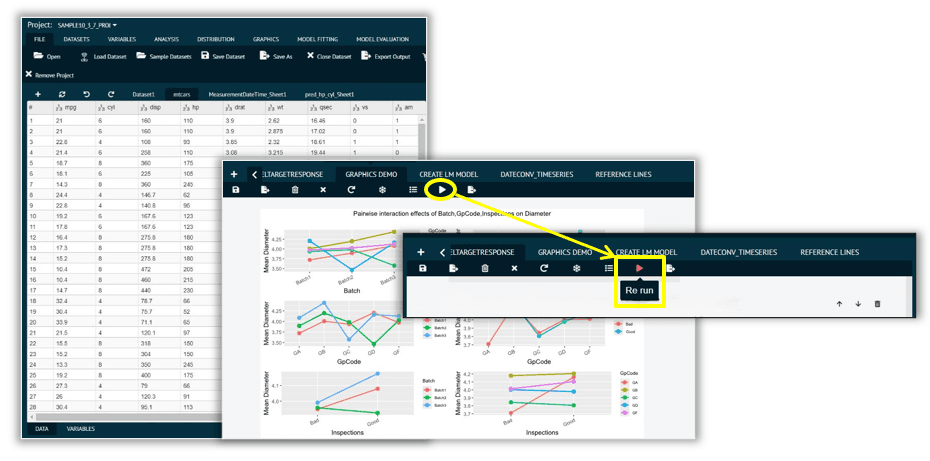
BioStat Prime is a user friendly, purpose-built biostatistical software designed for scientists, researchers, and students seeking a smarter way to analyze data offering a seamless, code-free solution for managing research data and scientific projects by plotting insights, conducting tests, visualizing, and interpreting complex datasets effortlessly.

The Complete Workflow : Build → Analyze → Validate → Publish
BioStat Prime features a user-friendly environment with an easy-to-use point-and-click graphical interface, promoting efficient software utilization by scientists and researchers.

Get started instantly by importing data or copying directly from Excel. BioStat Prime’s Clean-Up Dialog helps adjust or remove rows and columns easily—ensuring datasets are ready for accurate, hassle-free analysis.

With BioStat Prime, your work remains secure and viewable at all times. Even after your subscription expires, you’ll retain full access to all your saved projects through our dedicated Viewer Mode.
Every dataset, analysis, and workflow step — preserved exactly as you left it.
No hidden catches. No locked files. No pressure to renew.
Whether you're working on a short-term project or a one-time study, you can subscribe when needed and still revisit your insights anytime, without renewing.

Examine a variety of datasets with Biostat Prime, get the analytical results, process parameters and stability data by using various statistical methods such as Descriptive statistic, hypothesis testing, regression analysis and multivariate analysis.

With BioStat Prime, curve fitting is just a click away. Whether you're analyzing trends or uncovering complex patterns, BioStat Prime simplifies both linear and nonlinear regression for all users.Simply choose the model you desire, and let the software handle the rest—fitting your data, generating detailed result tables, plotting the curve instantly, and interpolating unknown values with precision. It’s fast, accurate, and designed to streamline your statistical workflow.

With its powerful graphical data visualization functions, BioStat Prime allows users to generate comprehensive charts, graphs, and plots to enhance data interpretation and insight. Our scientific graphing software simplifies the plotting and graphical representation of complex statistical data and helps identify patterns and trends. By spotting correlations and outliers within datasets, BioStat Prime positions itself as the best graph making software and a reliable choice for scientific data analysis.

BioStat Prime provides easy reporting capabilities by exporting and transforming data into Html, Docx and pdf format, allowing users to generate clear and visually appealing reports summarizing their analyses, making it easier to communicate and act upon their research findings.

BioStat Prime features a built-in marketplace where users can freely browse, install, and manage a wide range of R functions and libraries to expand the software’s capabilities.
Users have the flexibility to install or hide packages based on their needs—making our biostatistical software adaptable for both basic and advanced users.
Need assistance installing packages? Our support team is here to help! Simply reach out to us at support@biostatprime.com, and we’ll take care of it for you.

Save and export your analysis into one or more projects in .bsp file and effortlessly share them with other BioStat Prime users for access, modification and rerunning of analyses. This feature streamlines collaboration, enhances sharing efficiency and ensures reproducibility through independent validation and auditing of results.

BioStat Prime is more than just statistical software; it's a scientific chart software trusted across life sciences, healthcare, and academic research. Whether you’re visualizing experimental outcomes or presenting large-scale clinical trial data, BioStat Prime transforms raw numbers into clear, publication-ready visuals.
Unlike traditional tools that struggle with complex datasets, BioStat Prime is designed as a scientific graphing software for advanced biostatistical research. With support for multi-dimensional plotting, nonlinear curve fitting, and correlation analysis, it empowers scientists to interpret results with clarity and precision.
Not every scientist needs to code and with BioStat Prime, you don’t have to. Recognized as one of the best graphing software solutions, it combines a code-free, point-and-click interface with the statistical power required by researchers, ensuring accuracy without complexity.
BioStat Prime has become the preferred choice for graphs and charts in the medical, pharmaceutical, and life sciences fields. It enables professionals to create insightful, data-driven visuals that support decision-making, clinical reporting, and academic publishing,thus making it the best graph software in Biosciences & healthcare.
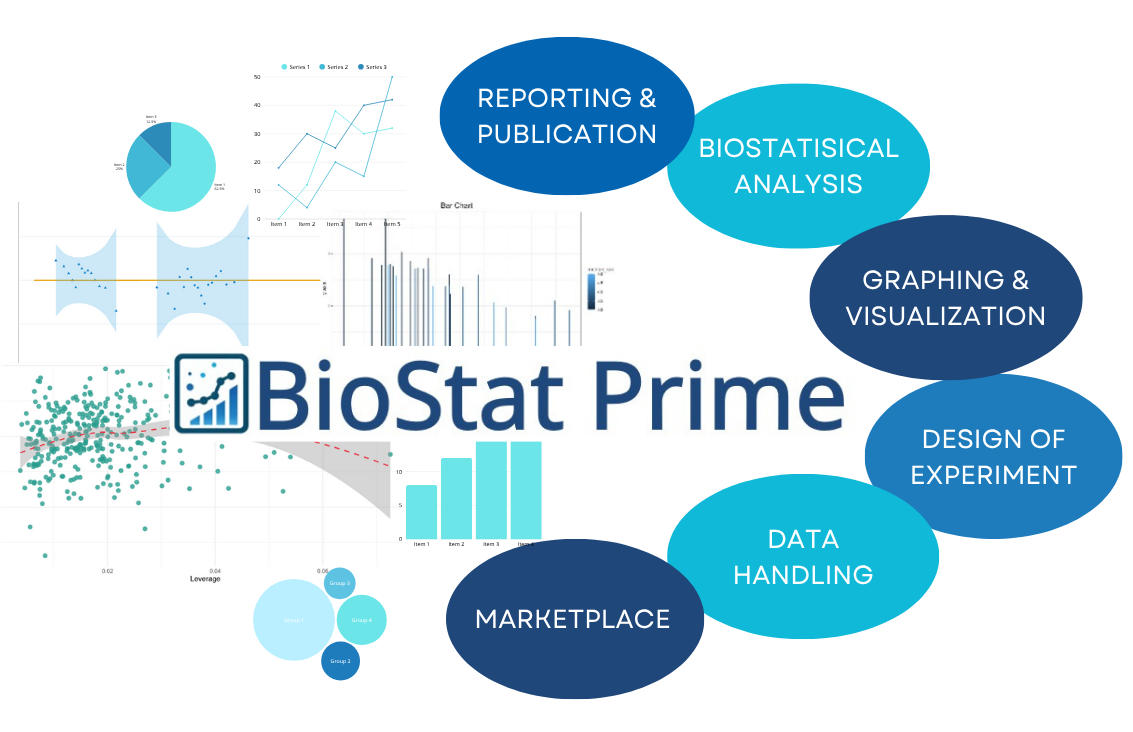
A one-stop destination for all skill levels — whether you're a beginner starting fresh with biostatistics or a professional aiming to master BioStat Prime. Our platform supports you at every step of your learning journey.
Understanding the Fundamentals
Unlocking Statistical Insights

Accurate analysis of categorical data is central to clinical research, epidemiology, pharmacology, and many areas of biological science. When researchers need to know whether
Read More
In day to day biostatistics and scientific data analysis, researchers deal with increasingly large and complex datasets. From clinical trials to epidemiological surveys and pharmaceutical R&D, data used is often imbalanced, redundant, or computationally heavy. To overcome these challenges, researchers rely on sampling techniques.
Read More
Nonlinear regression is a powerful statistical tool used to model complex relationships between independent and dependent variables when such relationships cannot be appropriately
Read MoreGet expert guidance with BioStat’s educational resources and tutorials, designed to help you master key statistical principles with confidence.
Step-by-step video tutorials to help you master statistical concepts with practical insights.
Comprehensive documentation covering advanced statistical techniques and methodologies.