In the world of biostatistics, biomedical research, life sciences, clinical trials, and data analytics, the accuracy of your statistical results depends on one critical factor that is correctly identifying the type of variable you are analyzing.
Whether you are comparing treatment outcomes, analyzing enzyme activity, evaluating patient responses, or reporting research findings, the classification of your data into Nominal, Ordinal, Interval, or Ratio variables determines which statistical tests, visualizations, and summary measures are scientifically valid.
Incorrect classification can lead to:
- Misleading averages
- Invalid p-values
- Incorrect statistical conclusions
- Flawed research publications or regulatory submissions
To avoid this, let's explore the four variable scales in detail.
Why Understanding Variable Types Is Crucial in BioStat Prime?
BioStat Prime is designed to be user-friendly and flexible. However, it assumes that the user understands what type of data is being input.
If categorical data is mistakenly treated as nominal or ordinal the scales are treated as continuous values, the software will still run your test, but your statistical results will be invalid
Suppose categorical data (like blood group, gender, or treatment type) is mistakenly treated as numerical or ordinal, it means you are assigning numbers to categories that don't actually have any quantitative meaning.
For example, you code:
- Blood group A = 1
- Blood group B = 2
- Blood group O = 3
If you then analyze this as if "3" means more than "1" or "2", the software assumes there is a real numerical order and distance between them but there isn't. These numbers are just labels, not values that can be added, averaged, or correlated.
Similarly If interval data (like temperature in °C or IQ score) is mistakenly treated as ordinal or categorical, you lose the meaningful distance between values.
For example, the difference between 20°C and 30°C is the same as between 30°C and 40°C, but treating them as categories ignores that equal spacing.
Conversely, if interval data is wrongly treated as ratio data, tests that rely on a true zero (like calculating ratios or geometric means) will be invalid, because interval scales lack a true zero point.
The software may still compute the values, but any interpretation involving ratios (e.g., "40°C is twice as hot as 20°C") would be incorrect
Correct data classification ensures:
| Benefit | Impact on Analysis |
|---|---|
| Appropriate summary statistics | Mean vs. Median; SD vs. IQR |
| Correct choice of hypothesis tests | Parametric vs. Non-parametric |
| Meaningful visual interpretation | Bar, Box, Scatter, or Histogram |
| Scientifically defensible results | Suitable for publication, thesis, or clinical reporting |
In short:
Correct variable classification = Correct analysis + Correct conclusions.
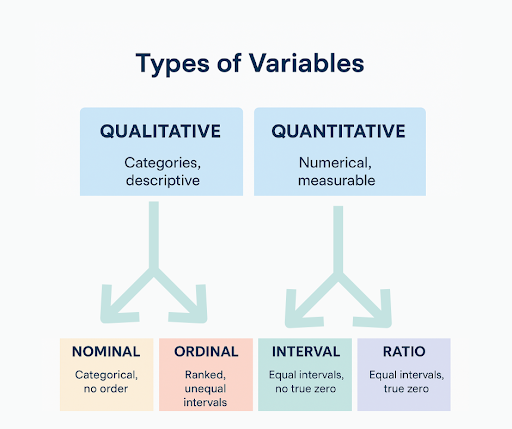
The Four Major Variable Types in BioStat Prime
Each variable type determines how data can be collected, summarized, visualized, and statistically analyzed within BioStat Prime. Understanding your variable type is essential, as it directly influences the choice of graphs, statistical tests, and interpretation of results.
In scientific research, variables define the nature of measurements, whether they are nominal, ordinal, interval, or ratio each carrying specific rules for how data can be analyzed and interpreted
Let's explore each variable type in detail:
Let's understand them below;
1. Nominal Variables (Categorical, No Ranking)
Nominal variables classify data into distinct categories. These categories do not have any inherent order or rank.
Examples
| Data Type | Nominal Variable Example |
|---|---|
| Clinical | Blood Type: A, B, AB, O |
| Microbiology | Bacterial Strain: Strain A vs Strain B |
| Research Groups | Treatment Group vs Control Group |
| Demographic | Gender, Ethnicity, Country |
Key Characteristics of Nominal Variables.
- Categories are labels, not measurements.
- You cannot calculate the mean.
- Numerical codes (e.g., Control = 1, Treatment = 2) should not be mathematically compared.
Valid Statistical Methods in BioStat Prime
| Purpose | Recommended Analysis |
|---|---|
| Compare group proportions | Chi-Square Test, Fisher’s Exact Test |
| Summarize distribution | Frequency tables, percentage tables |
| Visualize | Bar chart, Pie chart |
2. Ordinal Variables (Ranked but Unequal Intervals)
Ordinal variables indicate a ranking or order, but the difference between each rank is not uniform.
Examples
| Scale | Example |
|---|---|
| Pain Intensity | 1 = Mild, 5 = Severe |
| Patient Satisfaction | Poor → Fair → Good → Excellent |
| Tumor Staging | Stage I → Stage II → Stage III → Stage IV |
| Likert Survey | Strongly Agree → Agree → Neutral → Disagree |
Key Characteristics of ordinal variables
- Data has relative ordering.
- The spacing between levels is not measurable.
- Reporting the median is more appropriate than the mean.
Valid Statistical Methods
| Comparison Type | Recommended Test |
|---|---|
| Two groups | Mann–Whitney U Test |
| More than two groups | Kruskal–Wallis Test |
Best Visualizations for ordinal variables in BioStat Prime.
- Box & Whisker Plot
- Violin Plot
- Dot/Column Plot
3. Interval Variables (Numerical, Equal Spacing, No True Zero)
Interval variables have numerically meaningful distances between values, but zero does not represent absence.
Examples
| Parameter | Explanation |
|---|---|
| Temperature (°C or °F) | Zero temperature ≠ no temperature |
| Calendar Dates | 2000 is not "twice" 1000 |
| IQ Score | Zero does not mean no intelligence |
Key Statistical Capabilities
- Addition and subtraction are meaningful.
- Multiplication and ratios are not meaningful.
Appropriate Tests for Interval Variable in BioStat Prime.
- T-Test, ANOVA, Pearson Correlation
- Regression (with caution in interpretation)
4. Ratio Variables (Equal Spacing + True Zero)
Ratio variables include all interval properties plus a true zero, which means ratios and fold-changes are meaningful.
Examples
| Measurement | Explanation |
|---|---|
| Weight / Height | Zero means none |
| Concentration (mg/mL) | 10 mg/mL is twice 5 mg/mL |
| Enzyme Activity (U/mL) | Zero = no activity |
| Heart Rate / Blood Glucose | Zero = complete absence |
Valid Statistical Methods
Because this type is fully quantitative:
- Mean, Median, SD, CV
- t-Tests , ANOVA , Post-hoc Tukey test
- Regression , Correlation
- Fold-change & Log transformations
Common BioStat Prime Workflows
| Goal | Tool |
|---|---|
| Compare means | t-Test ANOVA |
| Analyze dose-response | Curve Fitting Models |
| Evaluate kinetics | Regression / Trend Lines |
Comparison Summary Table (Nominal vs Ordinal vs Interval vs Ratio)
Refer to the quick comparison table below to easily distinguish between the variable types
| Feature | Nominal | Ordinal | Interval | Ratio |
|---|---|---|---|---|
| Category or Numeric | Category | Category | Numeric | Numeric |
| Ordered | No | yes | Yes | Yes |
| Equal Intervals | No | No | Yes | Yes |
| True Zero | no | No | No | Yes |
| Example | Blood Group | Pain Scale | Temperature °C | Concentration |
| Best Test | Chi-Square | Mann–Whitney | t-Test / ANOVA | t-Test /ANOVA,Regression |
Examples of Interval and Ratio Variables
| Type | Variable Example | Why? |
|---|---|---|
| Interval | Temperature (°C) | Zero does not indicate absence of heat |
| Interval | pH Value | Scale has equal intervals but no absolute zero |
| Ratio | Weight (kg) | Zero = no weight; comparisons are meaningful |
| Ratio | Serum Glucose Level | Zero = absence of glucose |
How to Correctly Identify Your Variable?
When classifying your data, these are some essential questions to keep in mind
Does your data represent categories?
- Yes → Nominal or Ordinal
- No → Interval or Ratio
Do categories have a meaningful order?
- Yes → Ordinal
- No → Nominal
Is zero meaningful in your numeric scale?
- Yes → Ratio
- No → Interval
Nominal vs Ordinal
- Nominal: Categories without order (e.g., Blood Group)
- Ordinal: Categories with meaningful order (e.g., Pain Severity)
Interval vs Ratio
- Interval: No true zero (e.g., Temperature °C)
- Ratio: Has true zero (e.g., Weight)
FAQ
It includes non-parametric tests like Mann-Whitney and Kruskal-Wallis, which are ideal for ordinal variables where equal spacing cannot be assumed.
Correlation (Pearson/Spearman) is typically performed on interval or ratio variables.
Yes, by assigning a meaningful rank order (e.g., Disease severity scale), but this should be done only when the order truly exists.
It determines whether proportional comparisons (e.g., “twice as high”) are valid, something only Ratio data supports.
Conclusion
Understanding the four measurement scales Nominal, Ordinal, Interval, and Ratio is essential for selecting the correct statistical methods and interpreting results accurately in biostatistics. Each variable type carries different properties related to order, numerical meaning, and the presence of a true zero, and these characteristics ultimately guide which tests and visualizations are appropriate.
BioStat Prime simplifies this process by allowing users to define variable types at the time of data import and then recommending suitable statistical tests accordingly. Whether you are analyzing qualitative patient categories, ranking clinical responses, measuring laboratory parameters, or comparing treatment effect. Understanding this ensures that the tests you perform in BioStat Prime or are scientifically sound, reproducible, and publication-ready.
Right Data Type → Right Analysis → Reliable Conclusions