From Data to Decisions & Quality:
Bridging the Gap with BioStat's Key Features
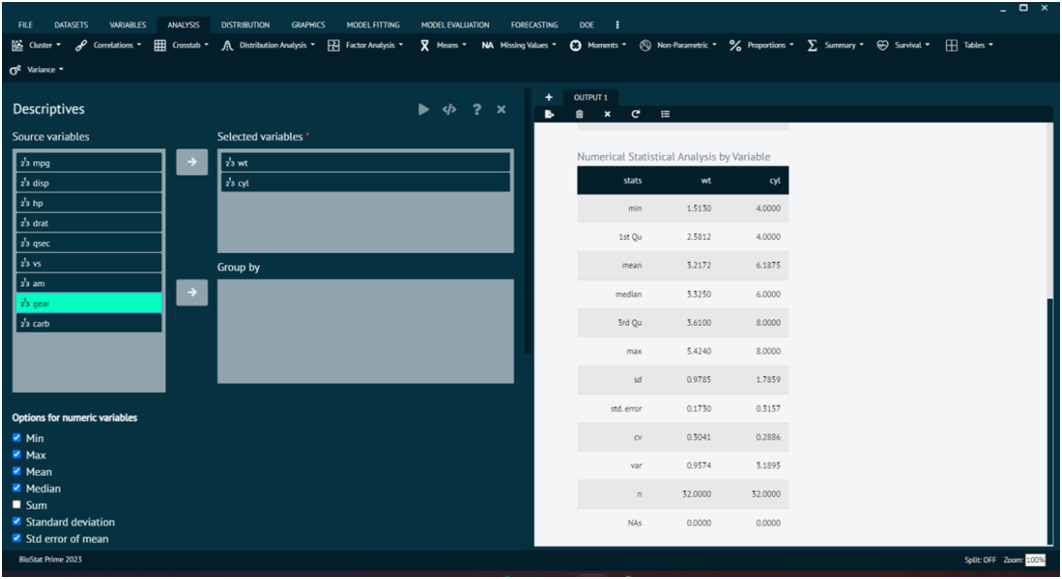
Descriptive Statistics
Inferential Statistics
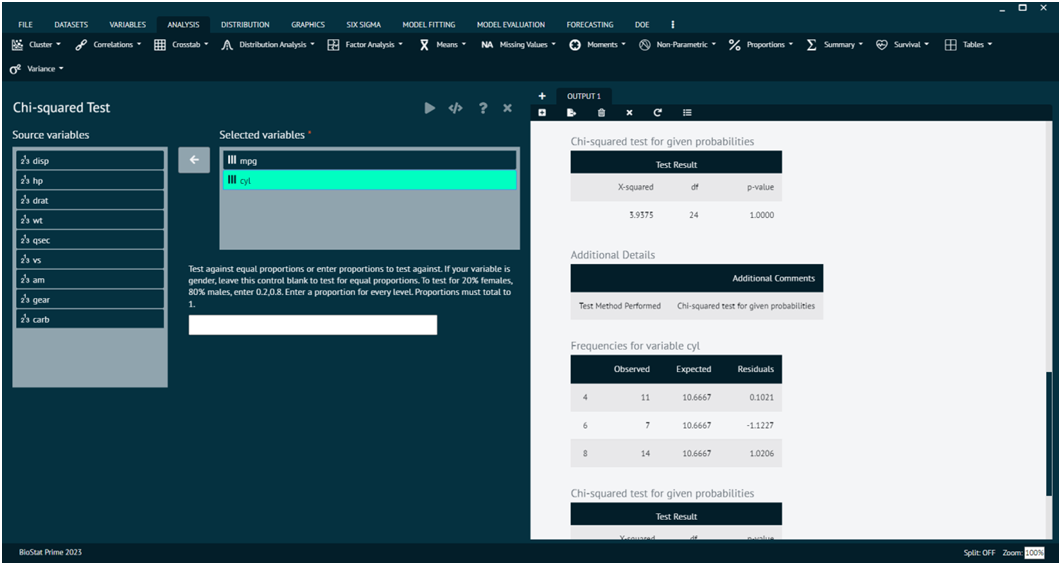
Hypothesis Testing
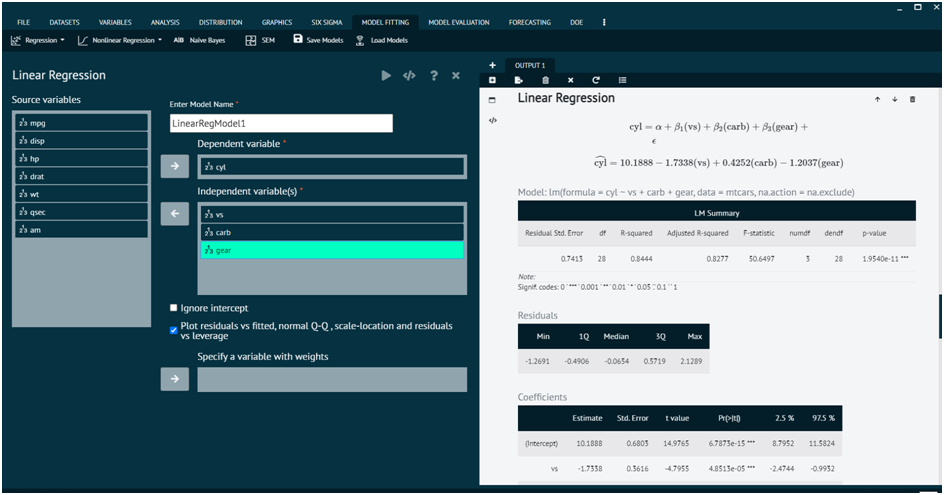
Regression Analysis
Survival Analysis
Distribution
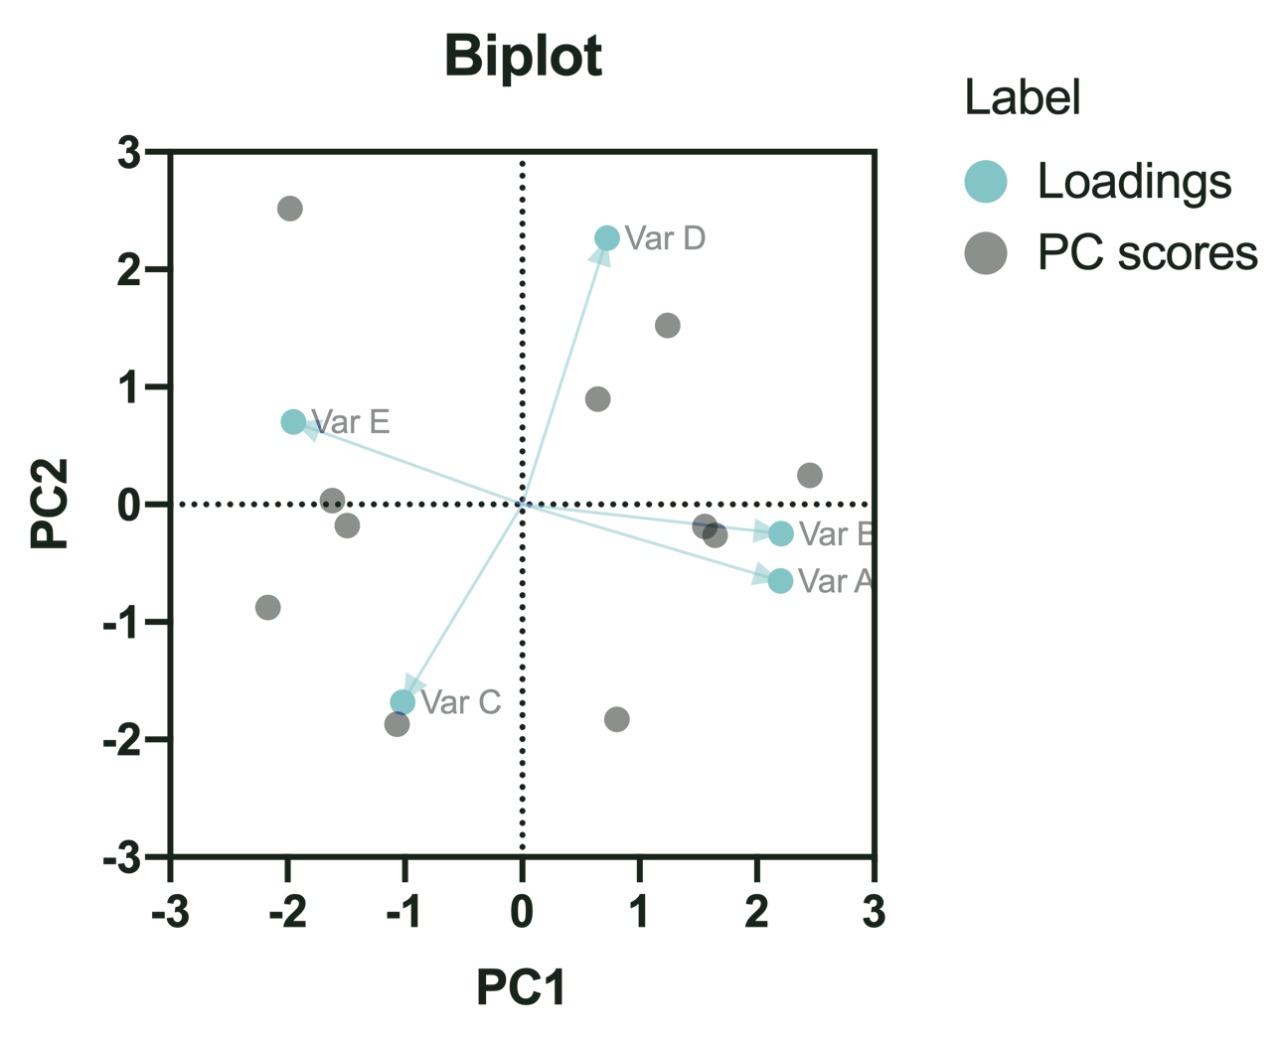
Principal Component Analysis
P-Values

DoE (Design of Experiment)
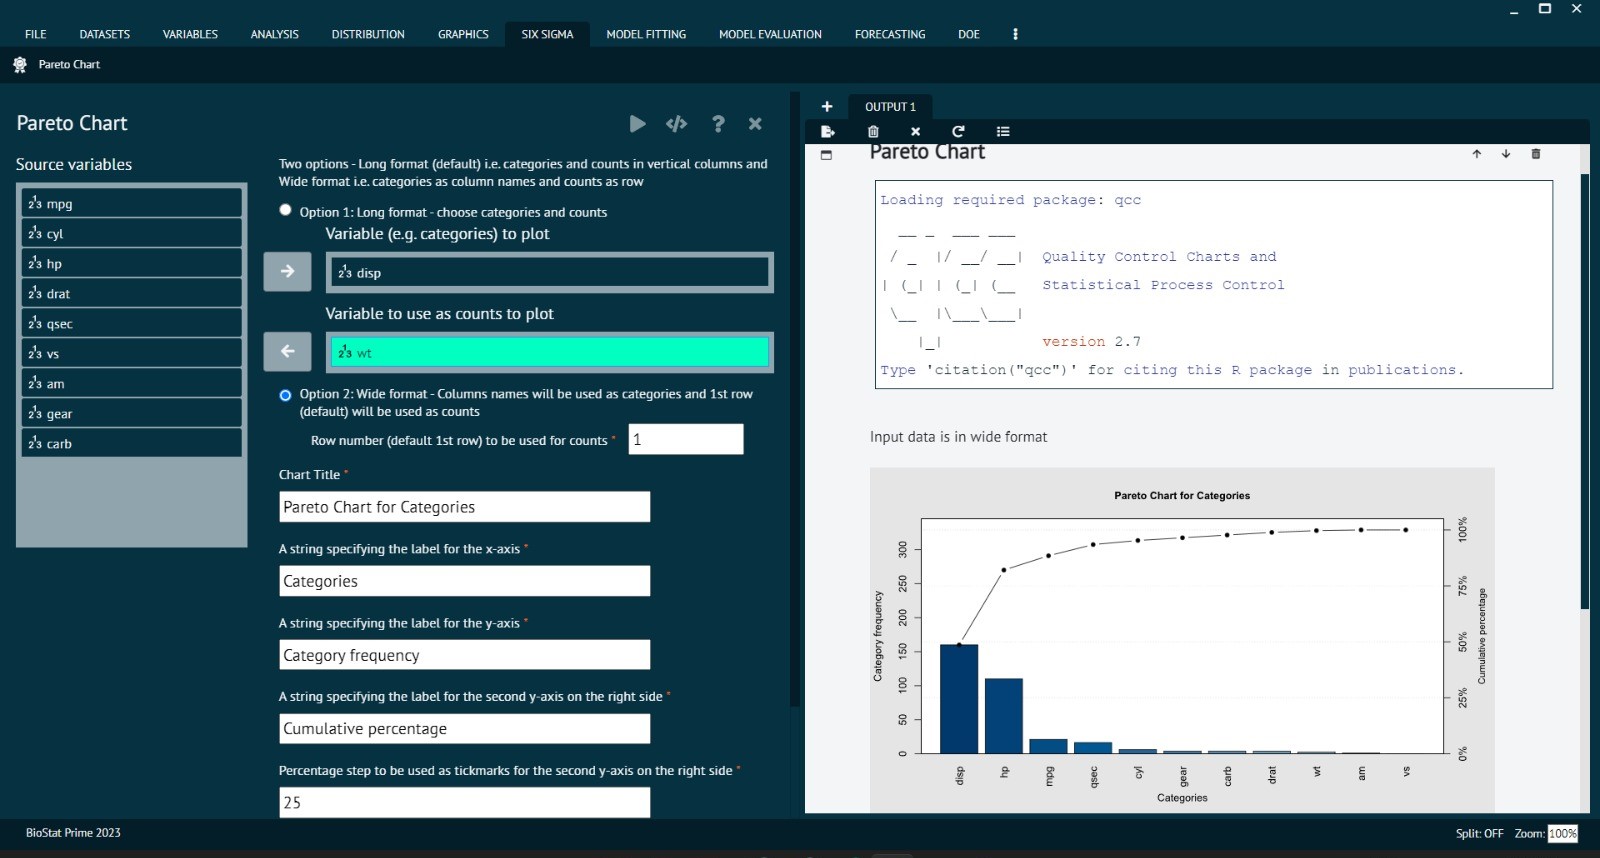
Pareto Chart
Effortless Data Interpretation and Powerful Analytical Solutions
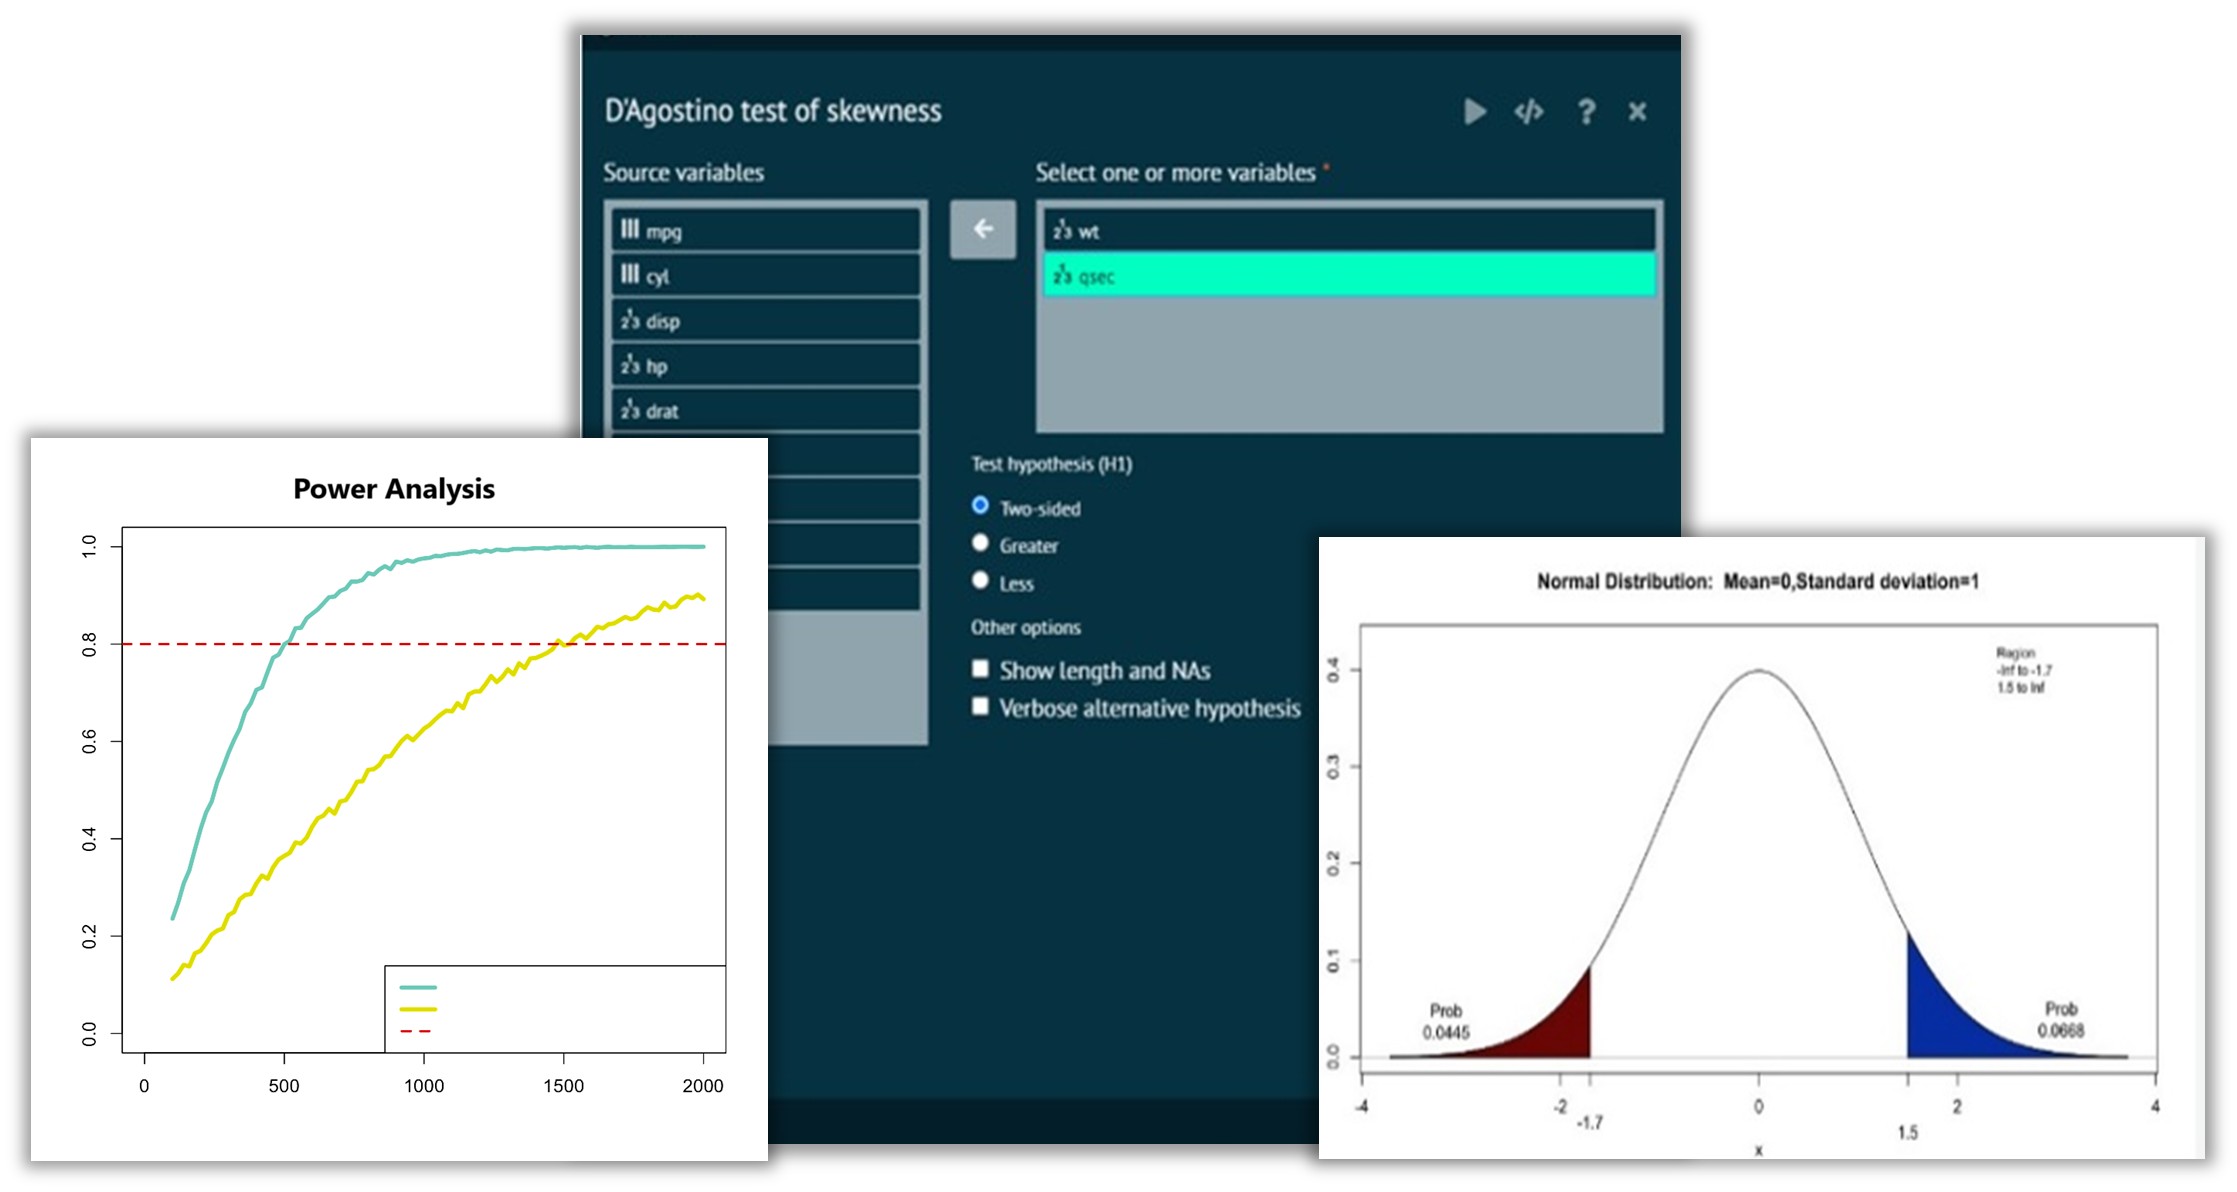
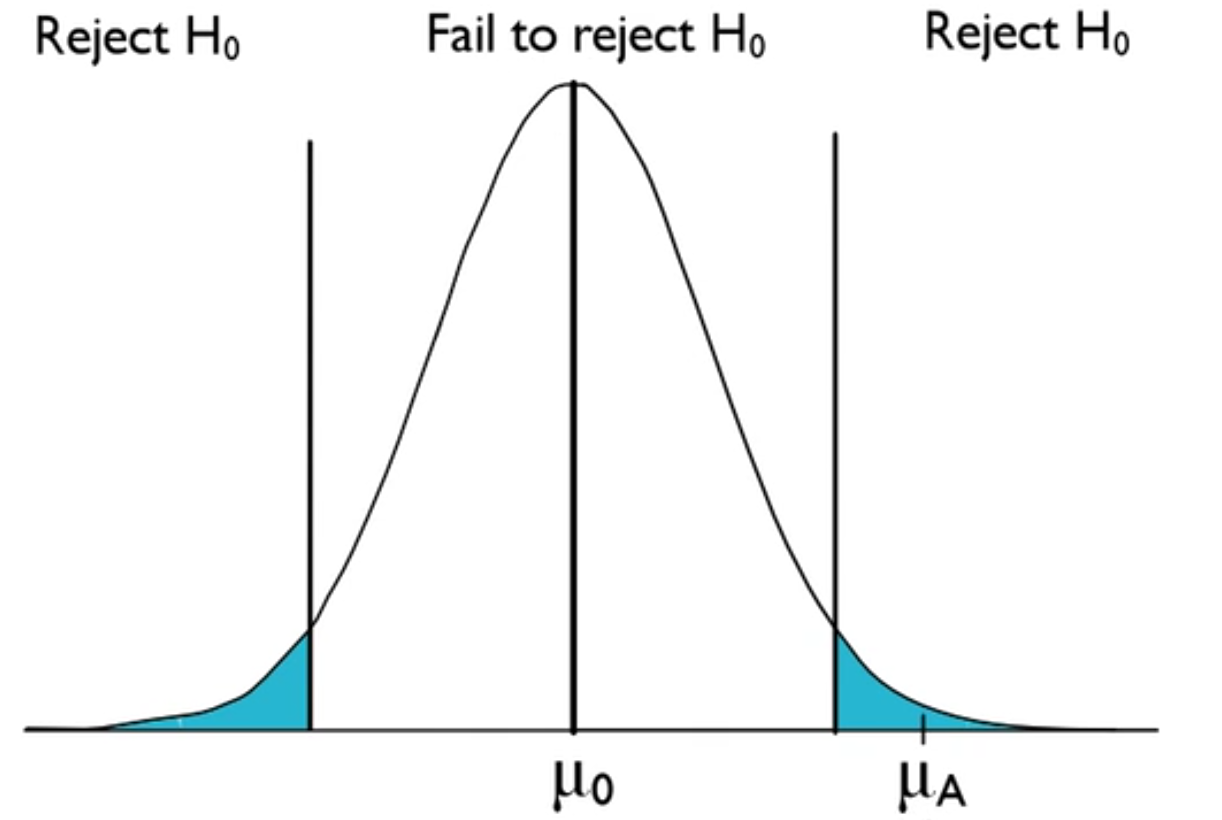
Power Analysis
Determine the statistical power of a hypothesis test about a population parameter and analyze data to either accept or reject the null hypothesis and maximize the internal validity of the experiment to draw accurate conclusions about the relationship between variables.
Discover the Breadth of Statistical Features Available in BioStat
Descriptive Statistics
- •Measures of Central Tendency: Mean, Median, Mode
- •Measures of Dispersion: Range, Variance, Standard Deviation, Interquartile Range (IQR), Mean Absolute Deviation
- •Measures of Shape: Skewness, Kurtosis
- •Measures of Relative Position: Z-Score, Percentiles, Quartiles
- •Frequency Distribution and Cross Tabulation (Contingency Tables)
Data Handling & Project Management
- •Import data from various formats CSV, DAT, Excel, RData, SAS, SPSS, STSTA, PSV, TSV, CSVY, ZSAV, XPT, RDA, RDS, DBF, ARFF, FEATHER, FST, JSON, MAT, ODS, HTML, XML, YML, PARQUET, PZFX, CSV.GZ, TEXT, BioStat, R script.
- •Summarizes numeric variables based on factor variables, producing an aggregated dataset with statistics like mean, median, SD, count, and more.
- •Split a dataset into multiple groups based on one or more factor variables.
- •Merge two datasets by matching common variable names, creating a unified dataset across shared identifiers
- •Stack multiple datasets vertically, appending rows from one dataset to another.
- •Sort rows based on one or more variables in ascending or descending order.
- •Extracts rows or columns from a dataset based on defined conditions or filters.
- •Find Duplicates: Detects and flags duplicate rows based on one or more selected variables.
Graphic Features
- •Basic Graphical Representations: Bar Chart, Histogram, Pie Chart, Line Chart, Box Plot (Box-and-Whisker Plot), Dot Plot, Scatter Plot, Area Chart
- •Advanced Graphical Representations: Heatmap, Contour Plot, Density Plot, Violin Plot, Stem-and-Leaf Plot, Radar (Spider) Chart, Pareto Chart, Treemap
- •Multivariate Visualizations: 3D Scatter Plot, Bubble Chart, Correlation Matrix Plot, PCA (Principal Component Analysis) Plot, Cluster Dendrogram, MDS (Multidimensional Scaling) Plot
- •Time Series Visualizations: Time Series Plot, Lag Plot, Seasonal Decomposition Plot
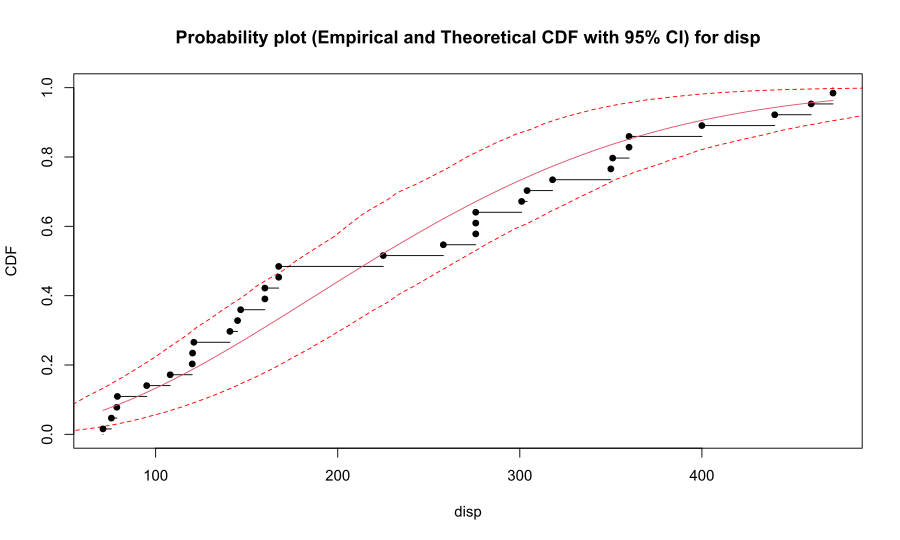
- •Distribution and Probability Visualizations: QQ Plot (Quantile-Quantile Plot), Cumulative Distribution Function (CDF) Plot, ECDF (Empirical Cumulative Distribution Function) Plot
- •Interactive and Dynamic Graphical Features: Interactive Dashboards, Web-based Visualization (e.g., Plotly, D3.js), Dynamic Filtering and Drill-Down Capabilities
Survival Analysis
- •Descriptive Methods: Kaplan-Meier Estimator, Life Table Analysis, Nelson-Aalen Estimator.
- •Comparative Tests: Log-Rank Test, Wilcoxon Test (Breslow Test),Tarone-Ware Test, Peto-Prentice Test.
- •Cox Proportional Hazards Model: Cox Regression Model, Time dependent Covariates in Cox Model.
- •Parametric Survival Models: Exponential Model, Weibull Model,Log-Normal Model,l Log-Logistic Model, Gamma Distribution Model
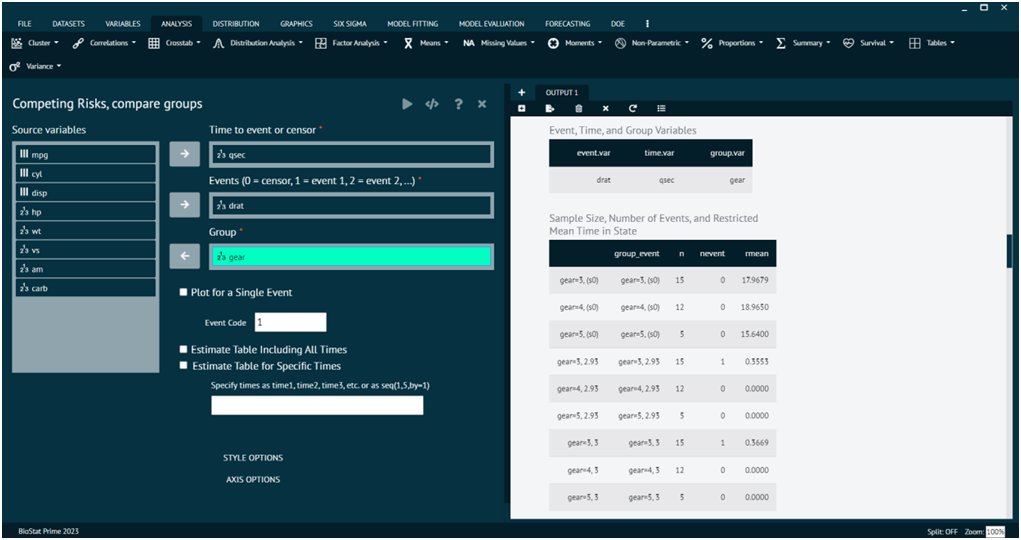
- •Survival Techniques: Accelerated Failure Time (AFT) Models, Competing Risks Models, Stratified Cox Model, Hazard Ratio Analysis.
Reproducibility
- •Load and rerun all analyses from any .bsp project file.
Reusability
- • Save and apply standard analysis steps (.bmd) to different datasets.
Statistical & Modelling Features
- •Frequency Analysis with Pareto Chart: Automatically create Pareto charts from frequency tables.
- •Nonlinear Least Squares Regression: Flexible all-purpose nonlinear modeling.
- •Polynomial Regression: Compare polynomial models of different degrees.
- •Distribution Fit Analysis Enhancements: Includes AD, KS, CVM test statistics & p-values.
- •Enhanced Proportion Tests: Improved suite of tests for proportions.
- •Outlier Diagnostics in Linear Models: Detect influential points, outliers, and leverage in regression.
- •Automatic Randomization for Simulations: In Normal Sampling & DoE designs.
Distribution Analysis
- •Tests for Assessing Normality (Normal Distribution): Kolmogorov-Smirnov Test, Shapiro-Wilk Test, Anderson-Darling Test, Lilliefors Test, Jarque-Bera Test, D'Agostino-Pearson Test, Ryan-Joiner Test
- •Tests for Specific Distributions (e.g., Exponential, Uniform, etc.): Chi-Square Goodness-of-Fit Test, Kolmogorov-Smirnov Test, Anderson-Darling Test, Cramer-von Mises Test, Runs Test for Randomness
- •Tests for Comparing Two Distributions: Two-Sample Kolmogorov-Smirnov Test, Mann-Whitney U Test, Wilcoxon Rank-Sum Test, Anderson-Darling Test for Two Samples, Levene's Test
- •Tests for Multivariate Distribution: Mardia's Test, Henze-Zirkler Test, Energy Test
- •Tests for Homogeneity of Distributions: Chi-Square Test of Homogeneity, Kolmogorov-Smirnov Test (Multi-Sample), Kruskal-Wallis Test
Factor Analysis
- •Preliminary Tests for Suitability Kaiser-Meyer-Olkin (KMO) Test Bartlett's Test of Sphericity
- •Methods of Extraction : Principal Component Analysis (PCA) Principal Axis Factoring (PAF) Maximum Likelihood Method Alpha Factoring Image Factoring
- •Methods of Rotation : Varimax (Orthogonal Rotation) Quartimax (Orthogonal Rotation) Equamax (Orthogonal Rotation) Promax (Oblique Rotation) Direct Oblimin (Oblique Rotation)
- •Reliability and Validation Scree Test Parallel Analysis Factor Score Estimation
Multi-Language UI Support
- •UI available in 13 languages (menus, dialogs, and help content).
Inferential Statistics
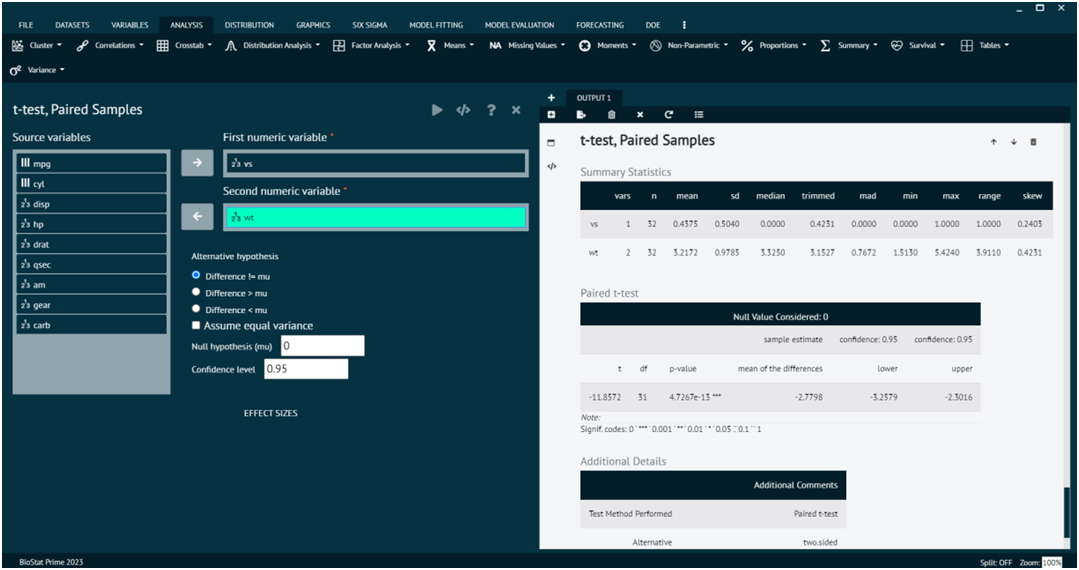
- •T-Tests: One-Sample, Independent Samples, Paired Samples T-Test
- •ANOVA: One-Way, Two-Way, Repeated Measures ANOVA, MANOVA (Multivariate Analysis of Variance)
- •Regression Analysis: Linear, Multiple, Logistic, Polynomial Stepwise Regression
- •Non-Parametric Tests: Mann-Whitney U Test Wilcoxon Signed-Rank Test Kruskal-Wallis Test Friedman Test Chi-Square Test of Independence Fisher's Exact Test
- •Correlation Tests: Pearson, Spearman's Rank, Kendall's Tau Correlation
- •Goodness-of-Fit Tests: Chi-Square Goodness-of-Fit Test, Kolmogorov-Smirnov Test, Anderson-Darling Test, Z-Test F-Test
Graphics Enhancements
- •Enhanced Pie & Bar Charts: Show both % and counts on plots.
- •Enhanced Histogram: Show counts and overlay normal curves. Grouping options included.
- •3D Scatter Plot: Interactive, rotatable scatter plot in popup browser.
- •Scatterplot Matrix: View multiple scatterplots simultaneously.
- •Interval Plot with Confidence Intervals: Mean with CI bars; supports unlimited groupings.
- •Enhanced Scatterplot: Add reference lines; fit models like lm, glm, cubic, etc.
- •Advanced Line Chart: Unlimited reference lines; advanced formatting & grouping.
- •Enhanced Box Plot: Show numerical values and reference lines.
- •Main Effect and Interaction Plot: Visualize interactions between two or more factors.
- •Enhanced Normal Distribution Plot: Show shaded area, tails, and quantiles on the plot.
- •Time Series/Run Charts: Date/time axis formatting; flexible grouping & reference lines.
- •Date/Time Axis Formatting Options: Supports formatting up to microseconds with angle control.
Correlation
- •Parametric Tests : Pearson Correlation Coefficient
- •Non-Parametric Tests : Spearman's Rank Correlation Kendall's Tau Correlation Hoeffding's D Statistic
Non Linear Regression
- •Dose response Curve
- •Nonlinear Least Square.
- •Polynomial Non linear regression.
Whether you're an Advanced User or Manufacturer, Our Software is Your Partner in Achieving Your Goal
Quality Improvement with Pareto Chart
Streamline your workflow, reduce inefficiencies, and support data-driven decision-making with BioStat prime’s Pareto analysis. Prioritize the areas for process improvement and resource allocation, display both frequency and cumulative impact in a single pareto chart,highlight the most frequent contributors to a problem or outcome.

Powered by R
The integration of R programming leverage Biostat's Statistical computing capabilities and improves graphics performance and users can perform Statistical analysis using R without the need for direct coding.

DevEnvironment
This feature of BioStat Prime allows advanced users to extend the capabilities of BioStat Prime by building and integrating your own functions directly into the BioStat Prime.

R-console
R console integration enables advanced users to insert R code chunks and execute them straightaway within the console, increasing efficiency and flexibility of performing statistical analysis.

Longitudinal Data Analysis
Analyze data collected over time in real time and discover cause-and-effect relationships. Find evolving trends and patterns to inform strategic planning and eliminate any risk of recall bias.

Frequently Asked Questions
Yes, BioStat offers an easy-to-use simple interface with step-by-step guidance, making it suitable for both beginners and Advanced users.
No, Biostat Prime does not require an internet connection once it has been installed and activated. You can use the software offline without any interruptions. However, an internet connection may be needed for initial activation, updates, or support services.
BioStat Prime is ideal for scientific researchers, data analysts, students, academics, professionals, and anyone working with data-driven decision-making.
Biostats offer 30 days free trial period which allows you to explore features of BioStat prime before you make any decision of purchasing the software
Biostat Prime is designed to be compatible with the two most prevalent desktop operating systems: Microsoft Windows and macOS (Apple Macintosh). This ensures a broad user base can access and utilize its features.
- Import various file formats directly
- Copy and paste data from Excel or other applications using Ctrl+C and Ctrl+V
- Open existing BioStat Prime project files (.bsp)
Use the Dataset > Excel Cleanup option which provides various tools to adjust rows, columns, and data types regardless of how the data was loaded into the program.
Yes, it is possible as BioStat Prime supports undo and redo operations for both single-item and multi-item edits in the data grid.
Our Biostatistical software offers character-to-date/time conversion via Variables > Convert > Character to Date & Time, eliminating the need for complex format specifications. It intelligently handles partial data and time elements, with any missing components.
Use the Project save feature to save all open datasets and analyses into a .bsp file (BioStat Prime Project file).
Yes, the reproducibility feature of BioStat Prime allows you to share your exported .bsp projects files with other BioStat Prime users, who can then open, review, modify, and rerun your shared analyses.
- Save complete projects with datasets and analyses
- Load and rerun all analyses in a project with one click
- Apply standardized analysis steps to different datasets through mapping
- Set seed values for random processes when needed
We do provide a live online training program on BioStat Prime. Our Basic & Professional Training Module are carefully crafted considering the requirements of Beginner to Advance user alike or users can also refer to the user manual for step-by-step guidance.
Yes, you can rename output tabs by double-clicking them and entering a new name, helping you organize and categorize sets of analyses under meaningful tab names.
Load their shared .bsp project file using File > Open Project and you can rerun all analyses in one go to reproduce and validate their results.
- Pie charts and bar charts (showing percentages and counts)
- Enhanced histograms with counts and normal curve overlays
- 3D interactive scatter plots
- Scatterplot matrices
- Interval plots with confidence intervals
- Enhanced scatterplots with model fitting and reference lines
- Advanced line charts
- Enhanced box plots
- Main effect and interaction plots
- Time series plots / run charts
- Various distribution plots
Yes, BioStat Prime offers interactive 3D scatter plots and line plot that can be rotated 360 degrees.
Time Series, Advanced Line Chart, and Scatter Plot features offer extensive date/time formatting options for axes, including support for microsecond precision and configurable angle text labels to avoid crowding.
Yes, many plot types including Scatter Plot, Advanced Line Chart, and Time Series plots support adding unlimited horizontal and vertical reference lines.
Use the enhanced Analysis > Distribution Analysis > Distribution Fit P-value which computes AD, KS, and CVM tests with p-values and provides AIC and BIC values to compare multiple distribution fits.
Yes, BioStat Prime offers both parametric (Weibull, Exponential, Log Normal, Log Logistic, and Gamma) and non-parametric (Kaplan-Meier) methods for survival and failure analysis with censored data, as well as regression modeling to analyze covariate effects.
Yes, use Model Fitting > Polynomial to compute and fit orthogonal polynomial models with specified degrees and optionally compare multiple polynomial models of various degrees side by side.
The Linear Model fitting dialogs include a Fit and diagnostics for unusual observations option to perform outlier, influential points, and high leverage points analysis.
Yes, BioStat Prime includes DoE functionality for creating various experimental designs.
By default, BioStat Prime automatically randomizes the creation of any DoE design. You can also set a specific seed value for reproducibility if needed.
Yes, you can export the entire analysis content (tables and graphs) of a given output tab to HTML, MS Word, or PDF. Note that you must install Pandoc (available for free from pandoc.org) to use this feature.
The entire content of output tabs can be exported and results can be exported to HTML, MS Word, or PDF formats.
Yes, BioStat Prime supports 13 languages: English (default), Chinese Simplified, Chinese Traditional, Japanese, Korean, Spanish, German, French, Portuguese, Romanian, Arabic, and Turkish.
Select your preferred language from the dropdown in the settings window, apply the changes, and restart the application. The toolbar menus and dialog UIs will then display in your selected language.