Evaluating the effects of chemical substances on living organisms is an important part of toxicological and ecotoxicological research. One of the key parameters used in these assessments is EC50 (Effective Concentration 50%).
EC50 represents the concentration of a substance that produces a specified effect in 50% of the test population or produces 50% of the maximum measured response, depending on the experimental endpoint and analysis method.
In aquatic ecotoxicology, EC50 is frequently used in immobilisation studies involving Daphnia magna. These studies help researchers evaluate the effects of chemicals on aquatic organisms over defined exposure periods, commonly 24 and 48 hours.
Calculating EC50 requires properly organized concentration data, organism counts, and immobilisation observations, followed by appropriate statistical analysis.
ToxCore provides a structured workflow for performing EC50 analysis. Researchers can import experimental data, configure the required variables, select effect levels, and obtain EC estimates for different exposure periods.
In this guide, we explain how to calculate EC50 in ToxCore, from preparing your experimental dataset to interpreting the final results.
What Is EC50 in Toxicology?
EC50, or Effective Concentration 50%, is the concentration of a chemical substance that produces a specified effect in 50% of a test population under defined experimental conditions.
Unlike LC50, which measures mortality, EC50 is used to evaluate a particular biological or physiological response.
For example, in a Daphnia magna immobilisation test, the 48-hour EC50 represents the concentration estimated to immobilise 50% of the exposed organisms after 48 hours.
EC50 is commonly used for:
- Evaluating chemical toxicity in aquatic organisms.
- Assessing immobilisation in Daphnia magna studies.
- Measuring concentration-dependent biological responses.
- Comparing the effects of different chemical substances.
- Supporting environmental risk assessments.
- Conducting ecotoxicological research.
EC50 estimation helps researchers understand the concentration at which a chemical produces a defined biological effect.
Why Calculate EC50 Using ToxCore?
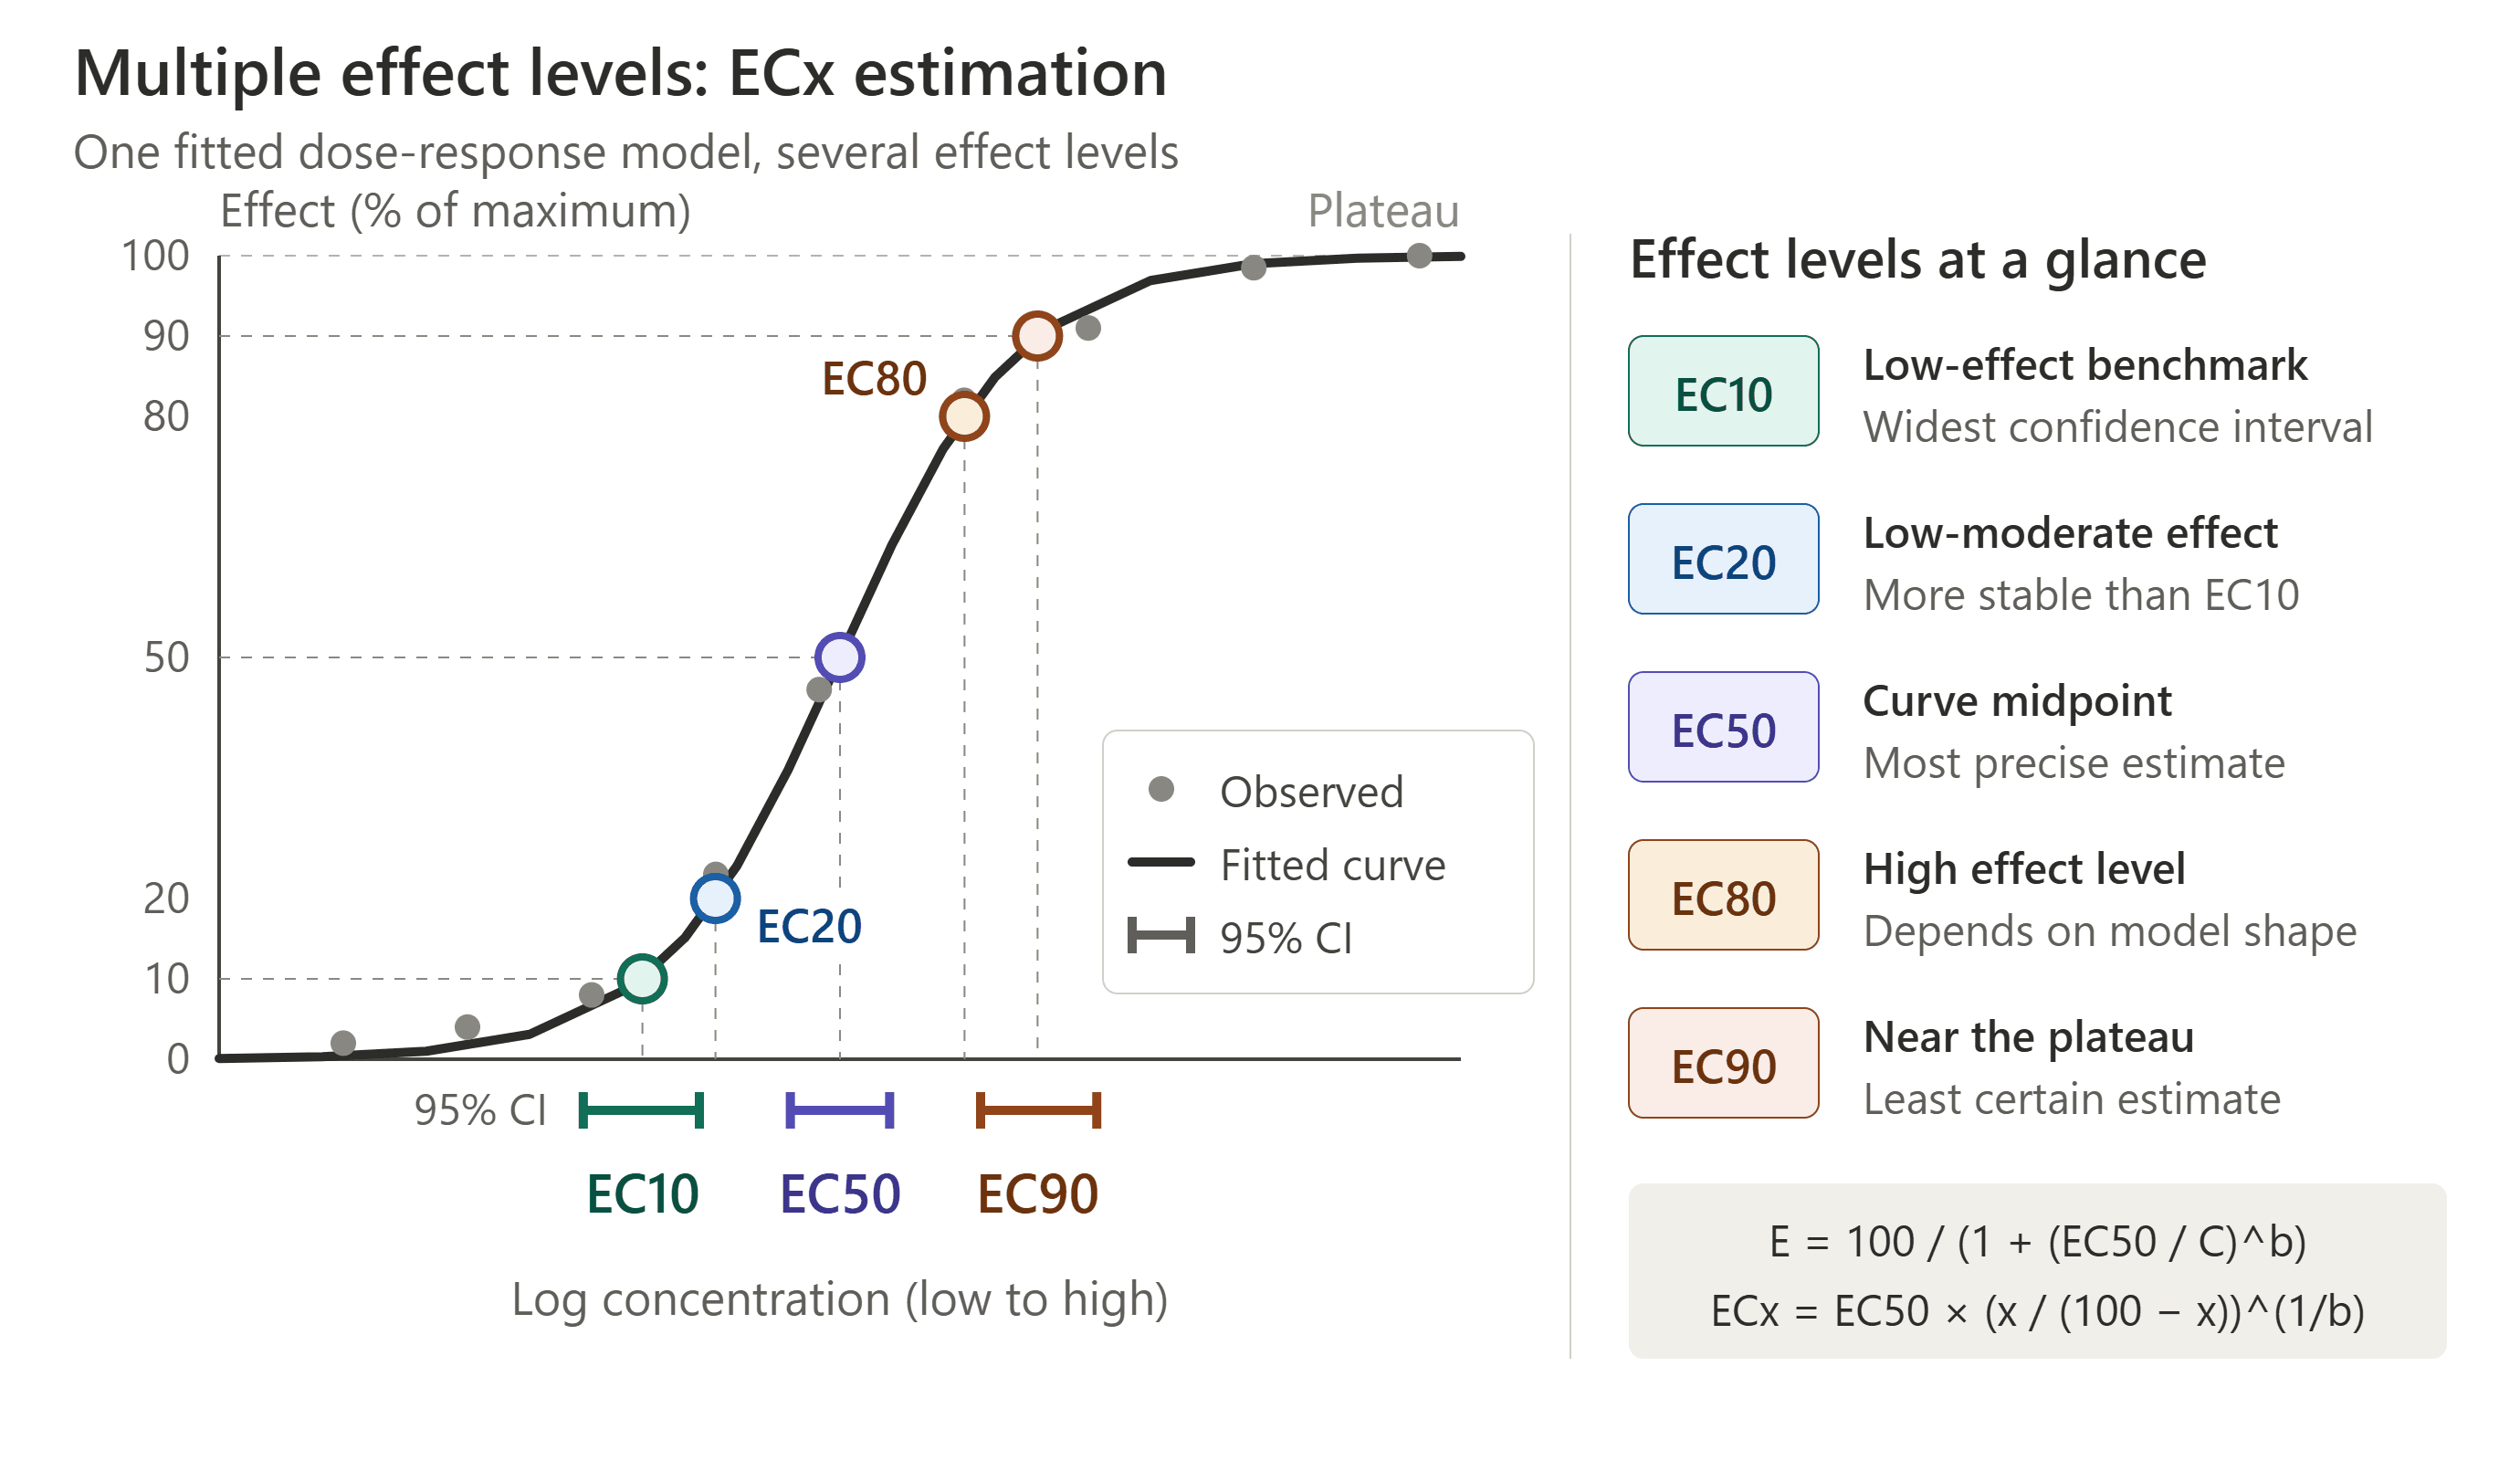
ToxCore is a statistical software solution designed for toxicologists to analyse experimental datasets and evaluate treatment-related effects.
For EC50 analysis, researchers need to examine the relationship between chemical concentrations and observed biological responses, such as immobilisation.
ToxCore provides a structured analysis workflow to process these observations and estimate effective concentrations at different exposure periods.
Key capabilities include:
- 24-hour and 48-hour EC50 estimation: Calculate effective concentration estimates for both exposure periods.
- Immobilisation data analysis: Analyse the number of organisms immobilised at different concentrations.
- Multiple effect levels: Estimate EC10, EC50, and other selected effect levels supported by the test.
- Confidence intervals: Review confidence intervals associated with the estimated EC values.
- Reliability assessment: Review the reliability notes provided with the EC estimates.
- Structured toxicity outputs: Access the calculated results in dedicated output tables.
These features help researchers organize and interpret ecotoxicity data within a single analytical workflow.
Steps to Calculate EC50 in ToxCore
Follow the steps below to perform EC50 analysis using ToxCore.
Step 1: Prepare Your Experimental Data
Before starting the analysis, organize your experimental dataset in a structured format.
Your dataset should contain one row per test vessel with the following columns:
| Variable | Description |
|---|---|
| Concentration | Test concentration, with the control represented as 0 |
| Number of organisms | Total number of organisms in each test vessel |
| Immobilised at 24h | Total number of organisms immobilised after 24 hours |
| Immobilised at 48h | Total number of organisms immobilised after 48 hours |
Important: Enter the total number of immobilised organisms observed at each time point.
For example, if 2 organisms are immobilised after 24 hours and 4 are immobilised after 48 hours, enter 2 in the 24-hour column and 4 in the 48-hour column if these are the cumulative observations at the respective time points.
Do not enter the additional number immobilised between 24 and 48 hours in the 48-hour field. The workflow requires total immobilisation counts at each observation time.
Step 2: Load Your Dataset into ToxCore
Once your experimental data is prepared:
- Open ToxCore.
- Import or load your prepared dataset.
- Verify that the concentration, organism count, and immobilisation columns are correctly recognized.
- Check that the values are assigned to the appropriate columns.
Ensure that your dataset contains the observations required for both 24-hour and 48-hour EC50 analysis.
Step 3: Open the Toxicology Test Suite
After loading your dataset:
- Navigate to the Toxicology tab in the main menu.
- Select Toxicology Tests.
- The OECD Ecotoxicology Test Suite dialog box will open.
This dialog provides the options required to configure your ecotoxicity analysis.
Step 4: Select the Test Type
Within the OECD Ecotoxicology Test Suite dialog:
- Locate the Select Test Type option.
- Choose the appropriate test type for your experimental study.
For immobilisation studies, ensure that the selected test type matches your experimental design and the organism-specific endpoint being evaluated.
Step 5: Assign the Required Variables
Next, map the columns from your dataset to their corresponding fields in the analysis dialog.
Assign the variables as follows:
| ToxCore Field | Dataset Variable |
|---|---|
| Concentration Variable | Concentration column |
| Total Daphnids per Concentration | Number of organisms |
| Immobilised at 24h | Total organisms immobilised at 24 hours |
| Immobilised at 48h | Total organisms immobilised at 48 hours |
Check each variable assignment carefully before proceeding.
Correct variable mapping ensures that ToxCore evaluates the relationship between the test concentrations and the observed immobilisation responses.
Step 6: Configure the Confidence Level and Effect Levels
After assigning the required variables, configure the statistical analysis settings.
1. Select the Confidence Level
Choose the confidence level for your EC50 analysis.
A 95% confidence level is commonly used in toxicological research. You can retain the default setting or select another level according to your experimental requirements.
2. Enable EC/LC Calculations
Locate the option:
Calculate LC10 / LC50 / EC50 / ErC50
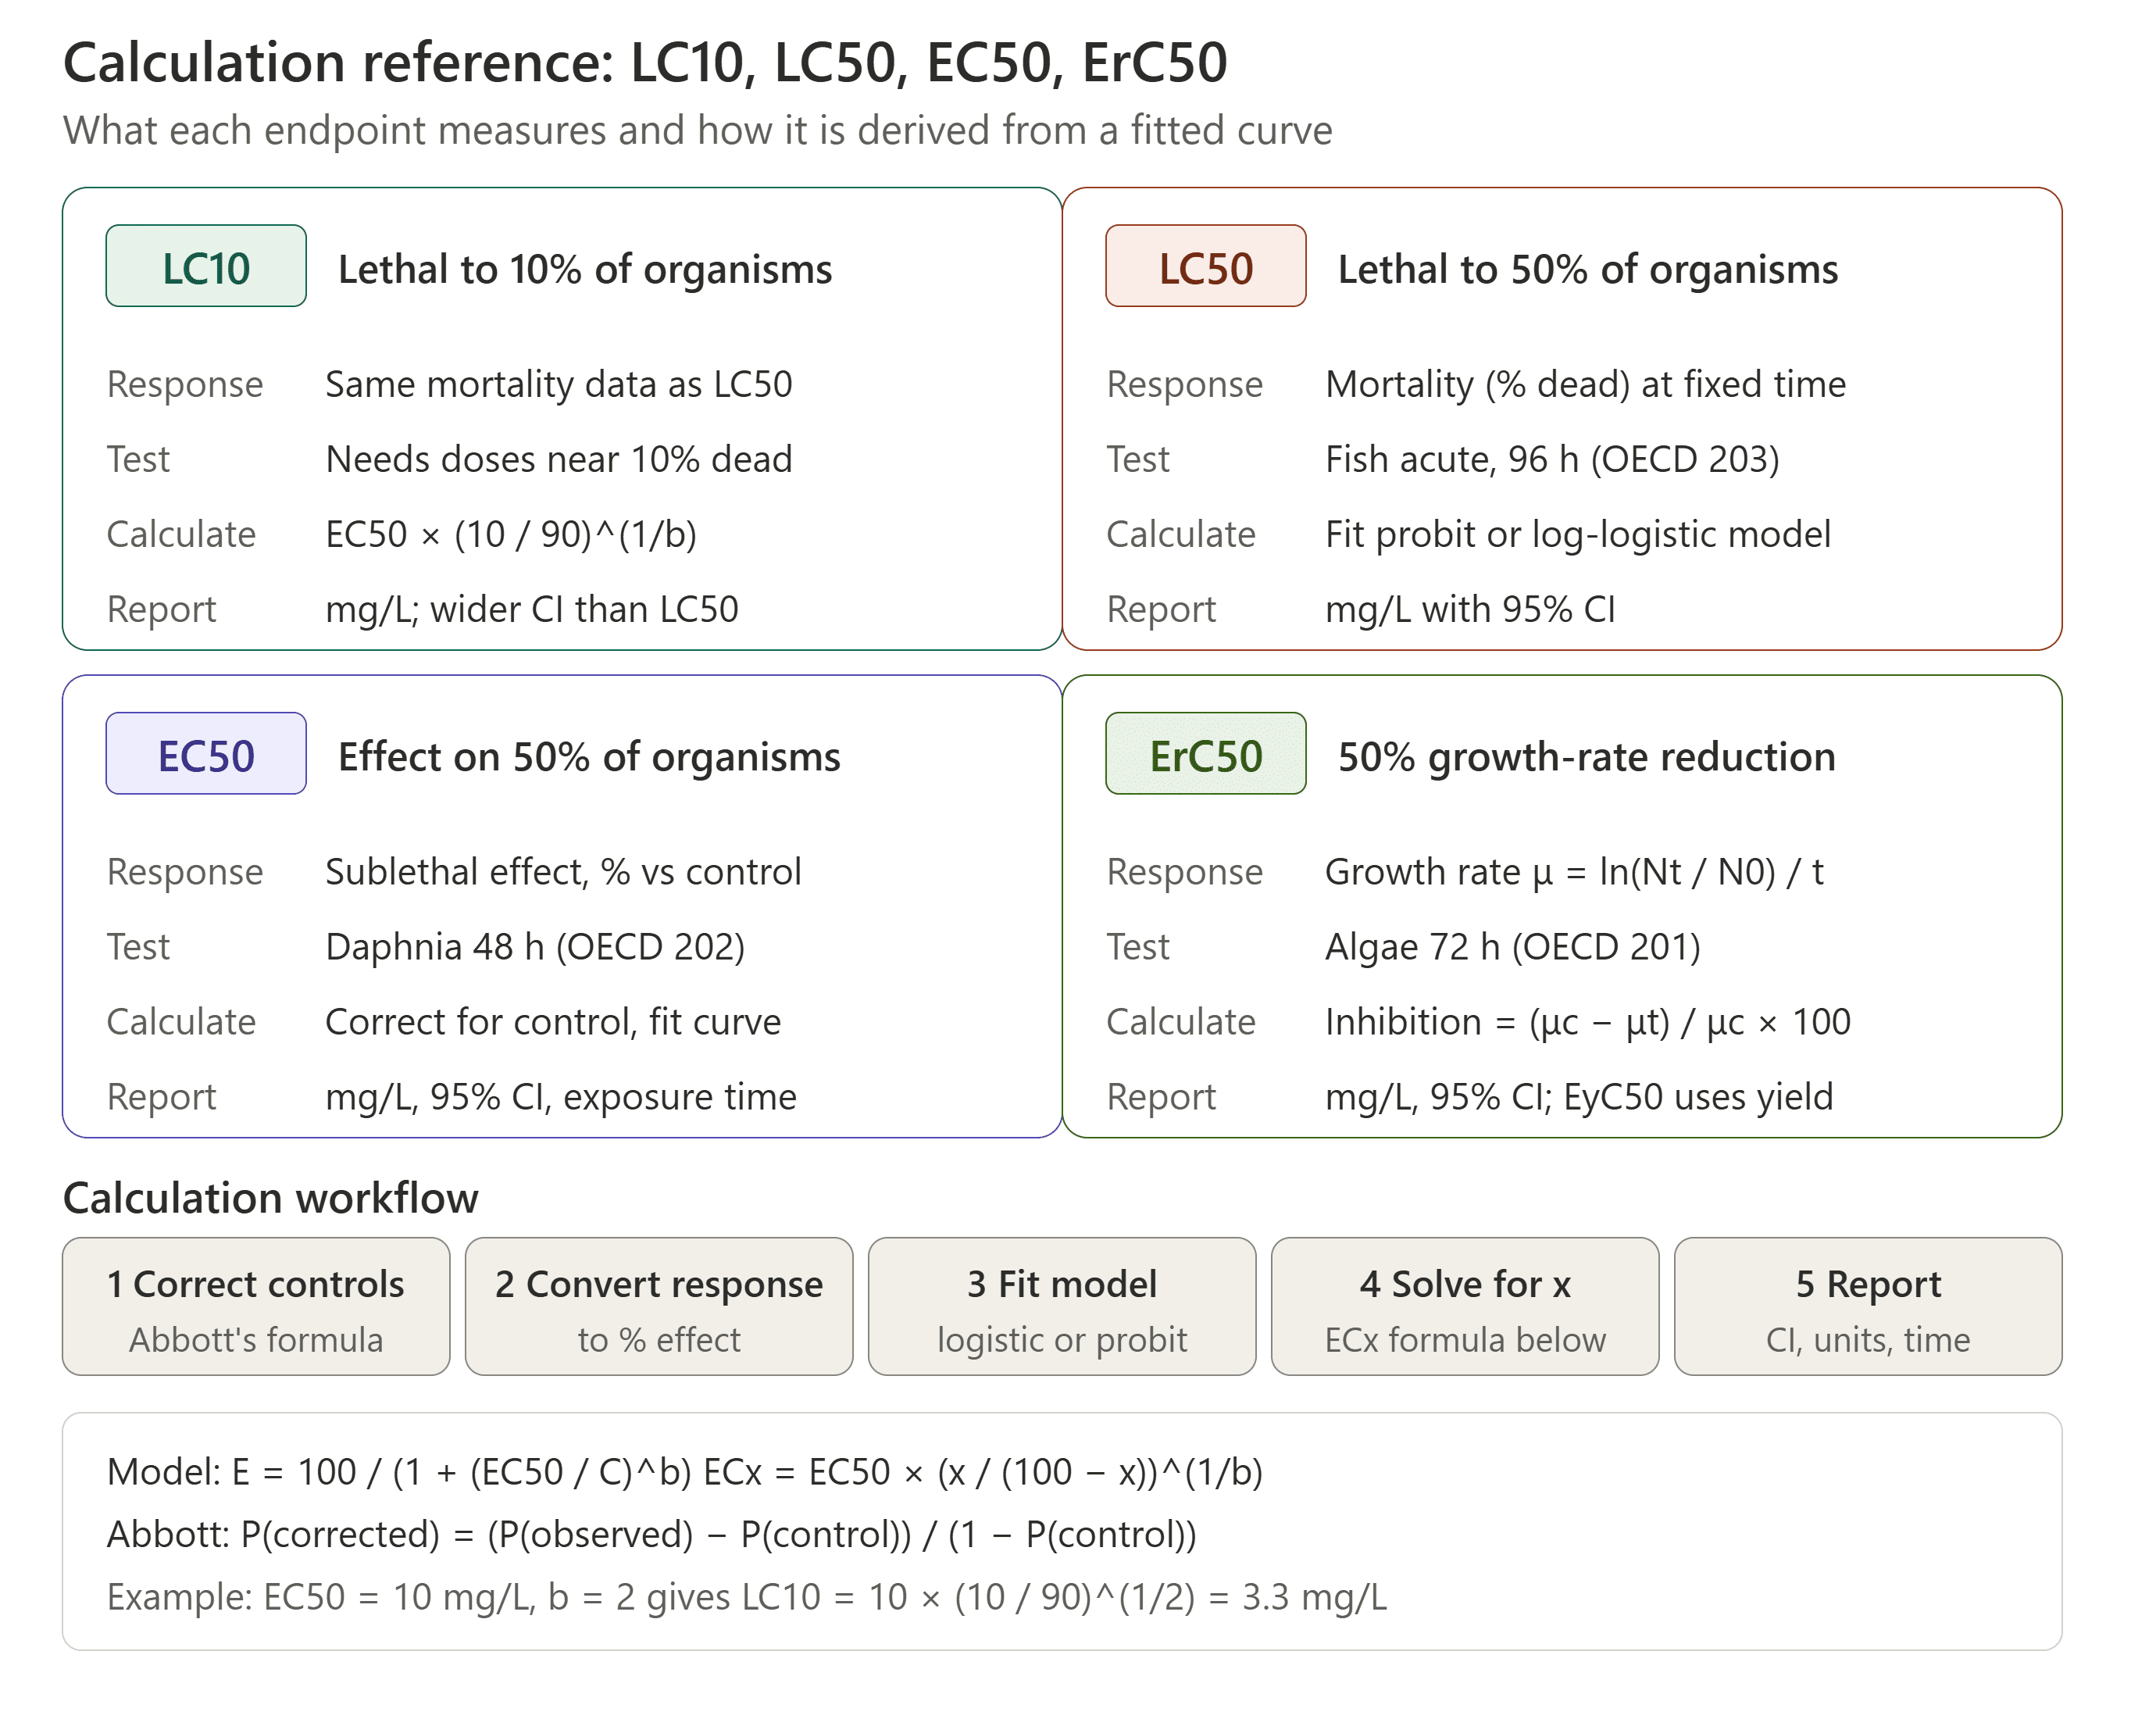
Enable this checkbox to activate the estimation of the selected toxicity endpoints.
3. Select the Effect Levels
Navigate to EC/LC Effect Levels to Estimate and choose the effect levels you want to calculate.
For example, selecting 10_50 allows you to estimate:
- EC10: Concentration associated with a 10% immobilisation response.
- EC50: Concentration associated with a 50% immobilisation response.
Choose the required effect levels according to your research objectives.
Step 7: Execute the Analysis
Once all the variables and statistical settings have been configured:
- Review the selected test type.
- Verify the concentration and organism-count assignments.
- Confirm the 24-hour and 48-hour immobilisation variables.
- Check the confidence level and selected effect levels.
- Click Execute to run the analysis.
ToxCore will process the experimental data and generate the corresponding EC estimates.
Step 8: Interpret the EC50 Results
After executing the analysis, review the output tables generated by ToxCore.
The software presents the EC estimates in two dedicated sections:
EC Estimates at 24h
This table presents the estimated effective concentration values for the 24-hour exposure period.
Researchers can review the EC estimates along with their associated confidence intervals and reliability notes.
EC Estimates at 48h
This table presents the estimated effective concentration values for the 48-hour exposure period.
It includes:
- Estimated EC values.
- Associated confidence intervals.
- Reliability notes.
These results help researchers evaluate the concentration-dependent immobilisation response over the two exposure periods.
Understanding EC50 Results: An Example
Consider an aquatic ecotoxicity experiment in which researchers expose Daphnia magna to different concentrations of a chemical substance.
The organisms are observed at 24 and 48 hours, and the number of immobilised organisms is recorded at each time point.
Suppose ToxCore estimates a 48-hour EC50 of 5 mg/L.
This indicates that the estimated concentration associated with immobilisation of 50% of the test organisms after 48 hours is 5 mg/L under the experimental conditions.
Illustrative EC50 interpretation
5 mg/L
Estimated 48-hour EC50
- Organism: Daphnia magna
- Endpoint: Immobilisation
- Exposure duration: 48 hours
- Interpretation: Estimated concentration associated with 50% immobilisation.
This is an illustrative example, not an actual ToxCore output or experimental result.
A lower EC50 generally indicates that a lower concentration is required to produce the specified effect, suggesting greater potency under comparable experimental conditions.
A higher EC50 indicates that a higher concentration is required to produce the same effect.
When comparing EC50 values, researchers should consider the test organism, exposure duration, experimental conditions, and endpoint definition.
Important Considerations When Performing EC50 Analysis
For reliable EC50 estimation, consider the following points:
- Prepare accurate observations: Ensure that immobilisation counts are recorded correctly at both 24 and 48 hours.
- Use the correct organism count: The total number of Daphnids should correspond to each test vessel.
- Include the control: Represent the control concentration as 0.
- Verify concentration units: Ensure that the selected concentration units match the experimental dataset.
- Select the appropriate test type: The selected test should correspond to your experimental design.
- Review confidence intervals: Consider the uncertainty associated with the estimated EC50 values.
- Check reliability notes: Evaluate the reliability information accompanying the estimates before drawing scientific conclusions.
If the experimental data do not adequately cover the response range, the EC50 may be poorly estimated or not estimable. Always review the confidence intervals and reliability notes when interpreting the output.
How to calculate EC50 from a graph ?
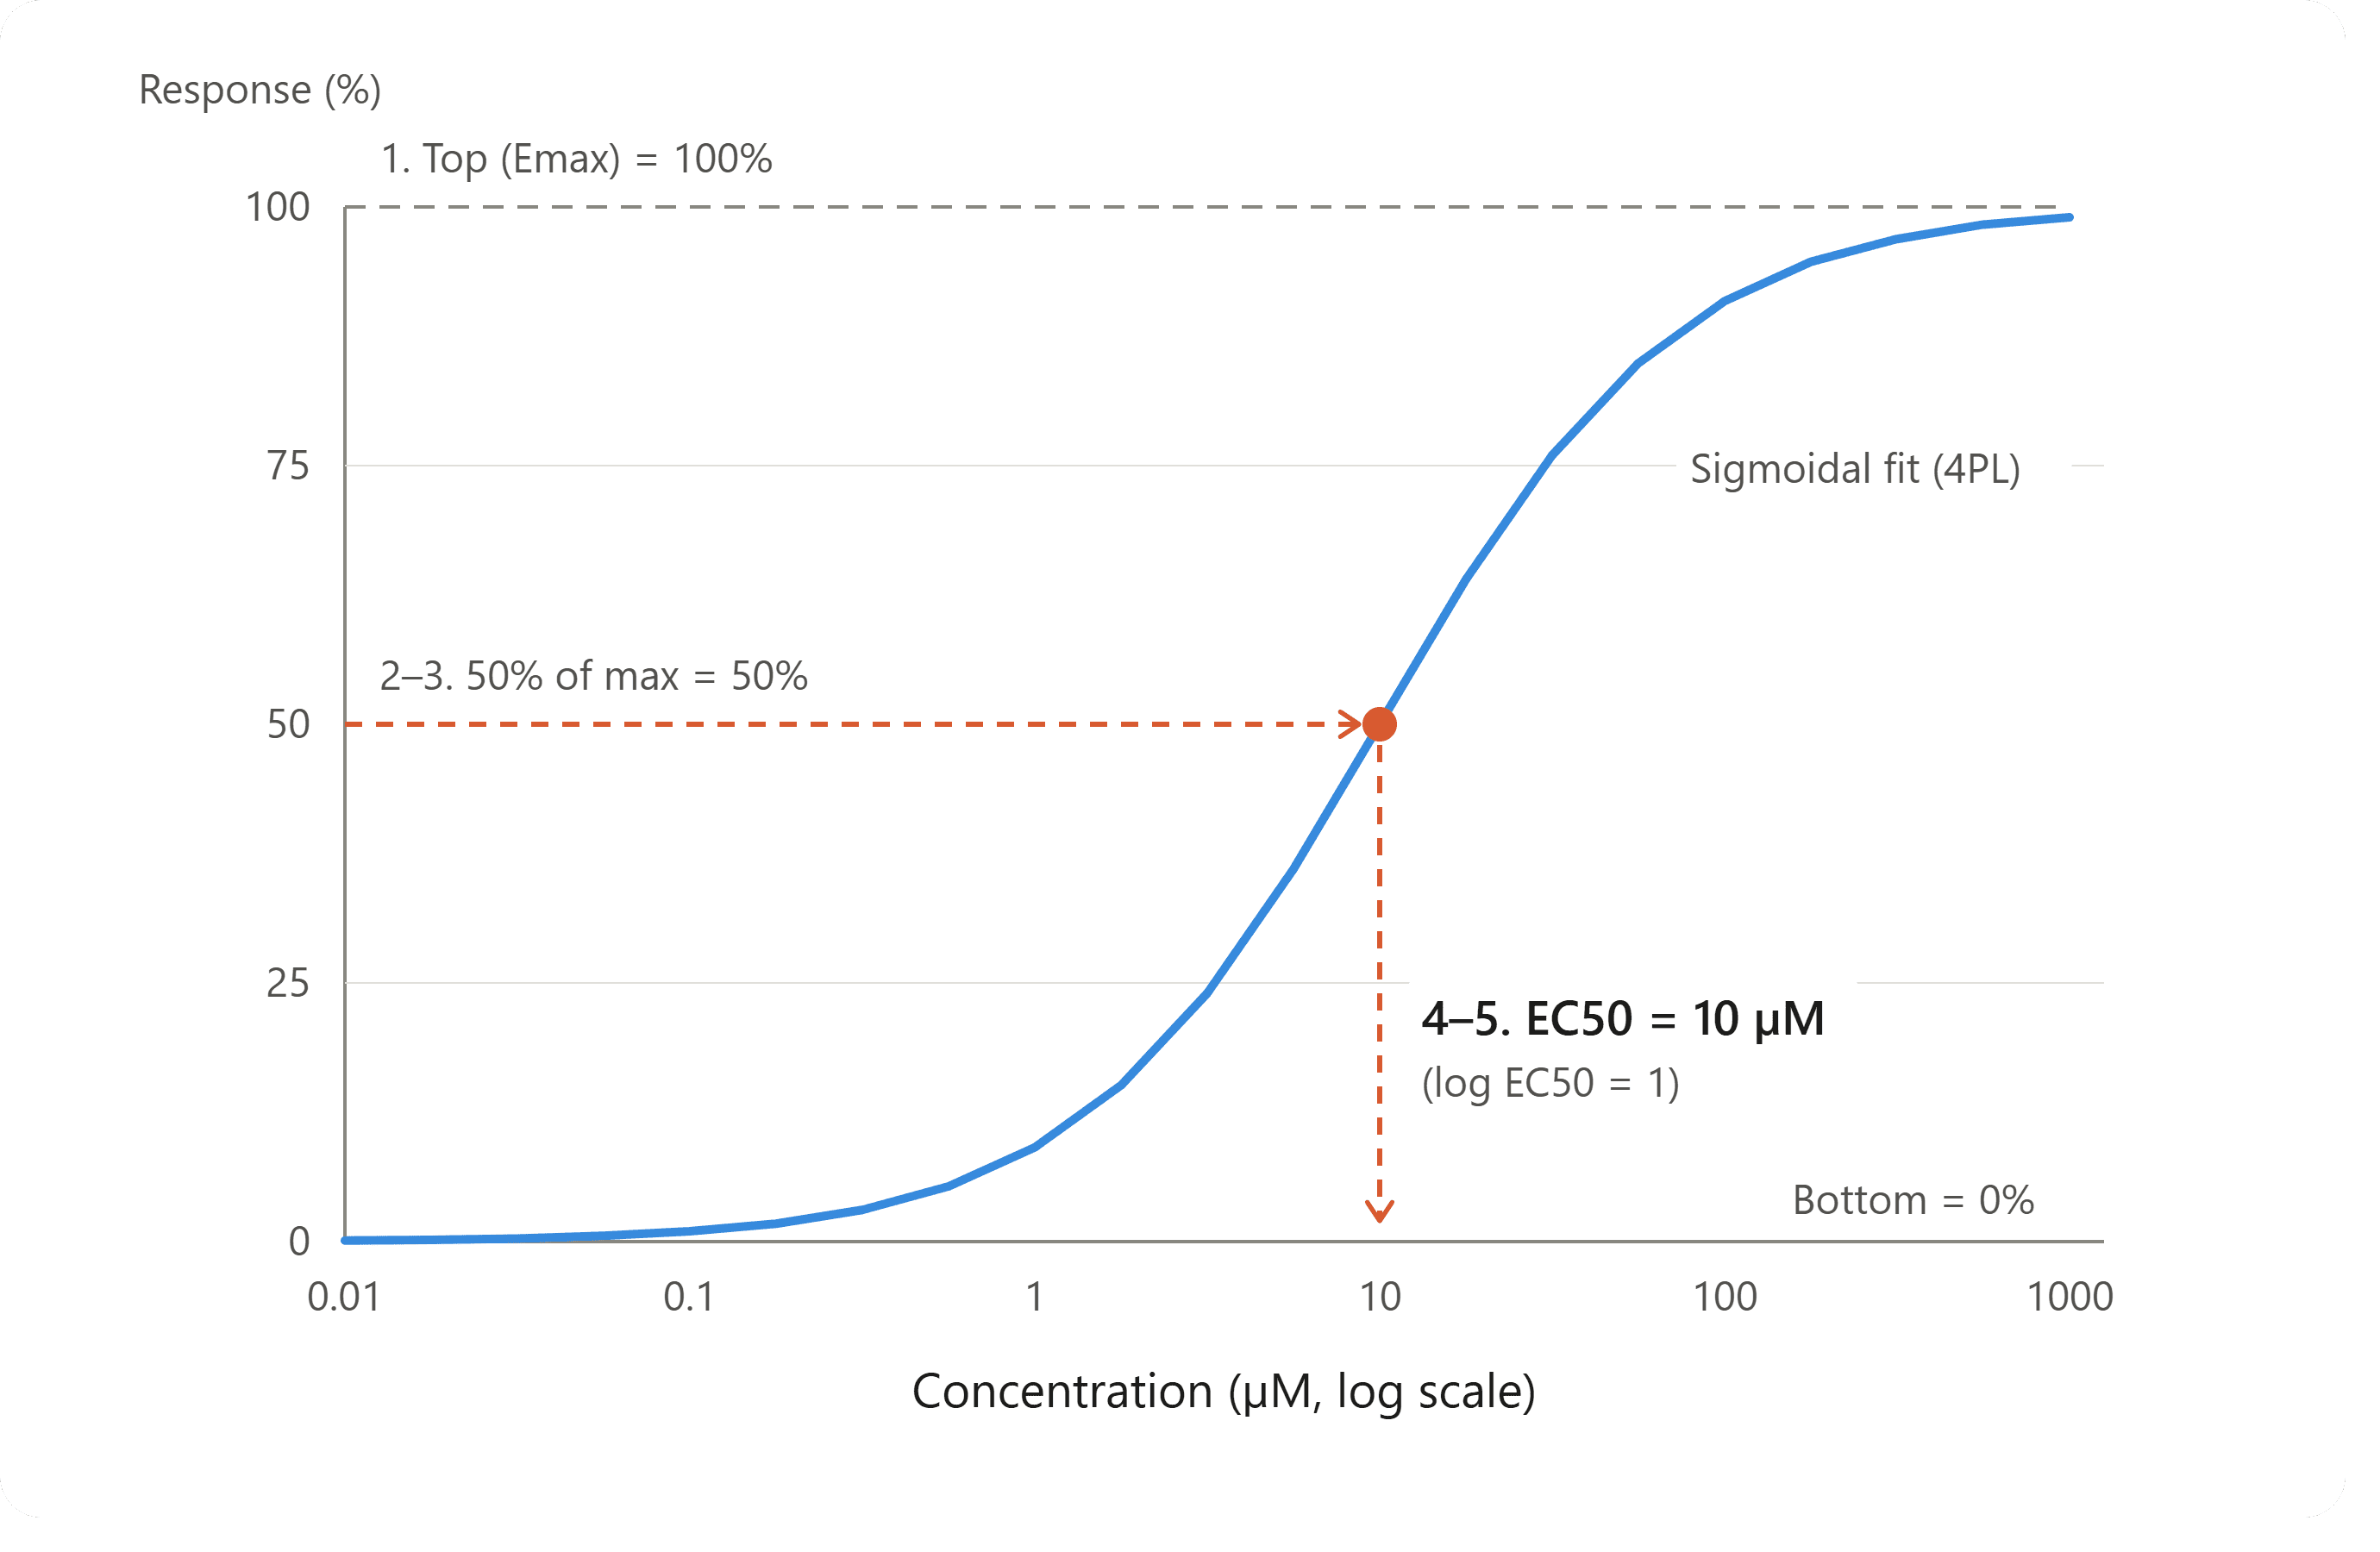
Follow these steps:
- Identify the maximum response (Emax): Find the plateau of the dose-response curve.
- Calculate 50% of the maximum response: If the maximum response is 100%, the midpoint is 50%.
- Locate 50% response on the Y-axis: Draw a horizontal line from 50% until it intersects the curve.
- Project down to the X-axis: Draw a vertical line from the intersection to the concentration axis.
- Read the concentration: The corresponding concentration is the EC50.
Suppose your graph shows:
| Parameter | Value |
|---|---|
| Minimum response | 0% |
| Maximum response | 100% |
| 50% response | 50% |
| Concentration at 50% response | 10 µM |
EC50 = 10 µM
If the maximum response is not 100%
For example, suppose:
- Minimum response = 10%
- Maximum response = 90%
The midpoint is:
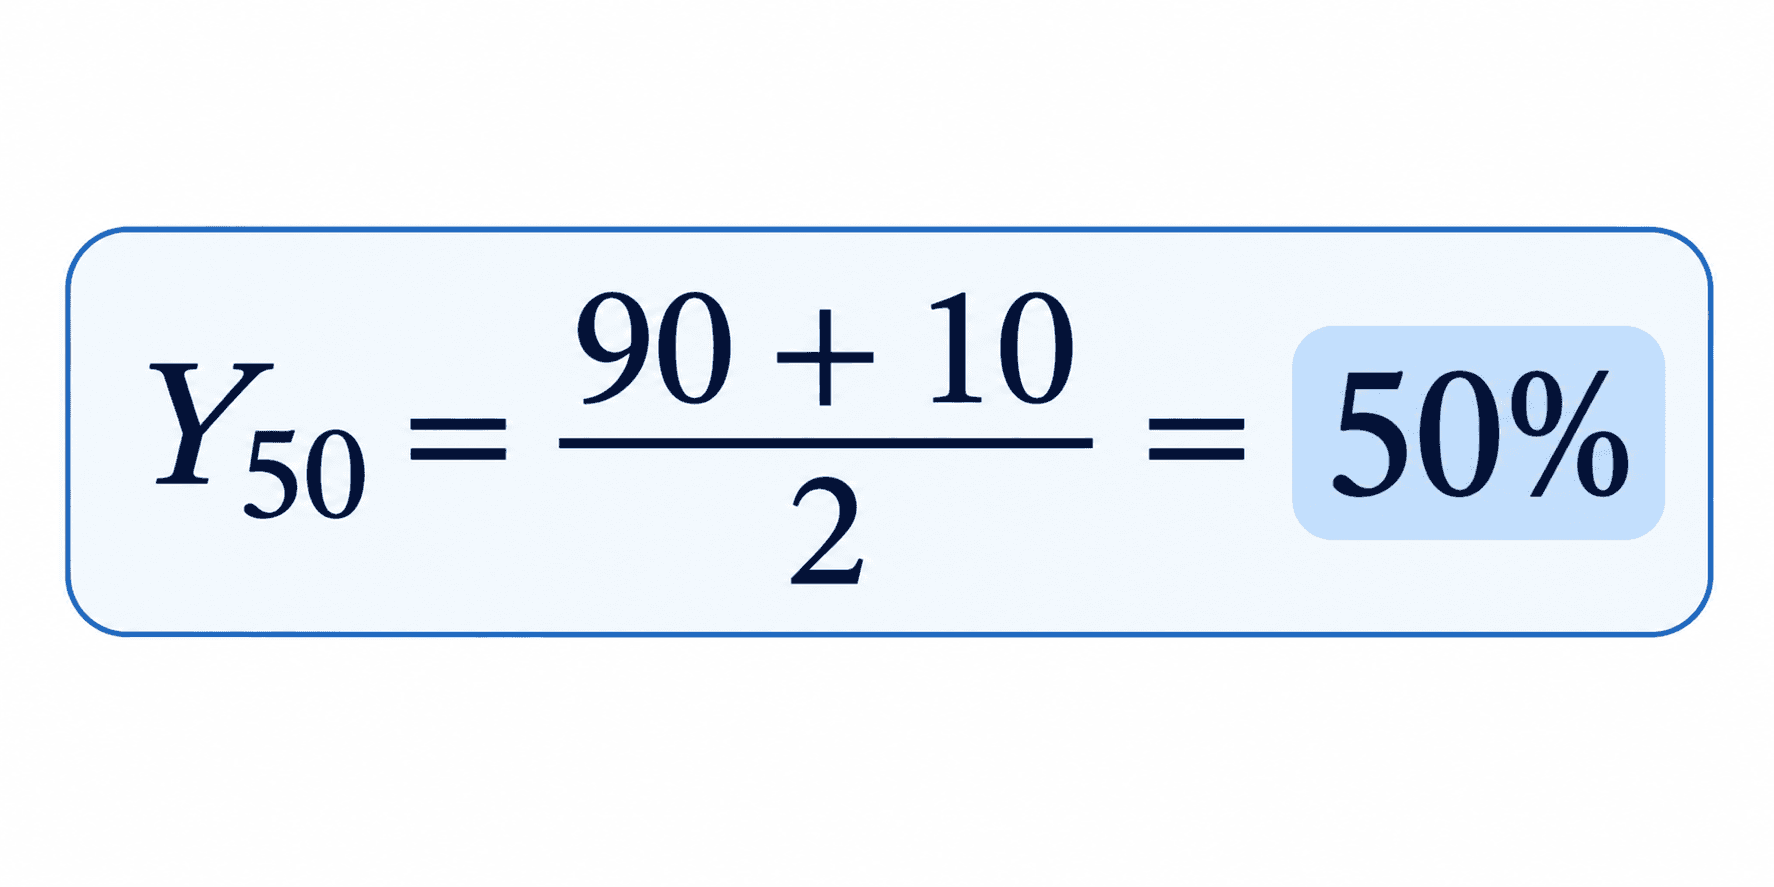
You must locate 50% on the Y-axis and identify the corresponding concentration.
How to calculate EC50 mathematically
The four-parameter logistic equation is:
Where:
- Y: Observed response
- Bottom: Minimum response
- Top: Maximum response
- LogEC50: Logarithm of EC50
- X: Logarithm of concentration
- HillSlope: Slope of the dose-response curve
Once LogEC50 is obtained:
EC50 = 10LogEC50
Understanding the Difference between LC50 & EC50
Although LC50 and EC50 are both important toxicological endpoints, they measure different biological responses.
| Parameter | LC50 | EC50 |
|---|---|---|
| Full form | Lethal Concentration 50% | Effective Concentration 50% |
| Measures | Mortality | A specified biological effect |
| Common application | Acute toxicity studies | Ecotoxicity and immobilisation studies |
| Example endpoint | Organism death | Daphnia immobilisation |
| Typical reporting | 24h, 48h, 96h LC50 | 24h, 48h EC50 |
Both parameters help researchers evaluate chemical toxicity, but the appropriate endpoint depends on the biological response being investigated.
Conclusion
EC50 estimation is an important component of ecotoxicological research, particularly when evaluating the effects of chemical substances on aquatic organisms.
However, obtaining reliable EC50 estimates requires properly structured experimental data, accurate immobilisation observations, and appropriate statistical analysis.
With ToxCore, researchers can streamline the EC50 calculation workflow by importing experimental datasets, assigning concentration and immobilisation variables, selecting effect levels, and generating EC estimates for both 24-hour and 48-hour exposure periods.
By providing dedicated result tables with confidence intervals and reliability notes, ToxCore helps toxicologists analyse and interpret concentration-dependent biological responses more efficiently.
Frequently Asked Questions
EC50 stands for Effective Concentration 50%. It represents the concentration of a substance estimated to produce a specified effect in 50% of a test population or a 50% response, depending on the endpoint and statistical model.
Import your experimental dataset, navigate to Toxicology → Toxicology Tests, select the appropriate test type, assign concentration and immobilisation variables, select the confidence level and desired effect levels, and click Execute.
Yes. ToxCore provides separate output tables for EC estimates at 24 hours and 48 hours when the corresponding immobilisation observations are supplied.
A 48-hour EC50 represents the estimated concentration of a substance associated with a 50% immobilisation response in the tested Daphnia population after 48 hours of exposure.
Yes. ToxCore provides confidence intervals alongside the EC estimates, allowing researchers to evaluate the uncertainty associated with the calculated values.
The required dataset includes test concentrations, total organisms per vessel, and total immobilisation observations at 24 and 48 hours.