How to Calculate LC50 in ToxCore: A Step-by-Step Guide to Toxicity Analysis
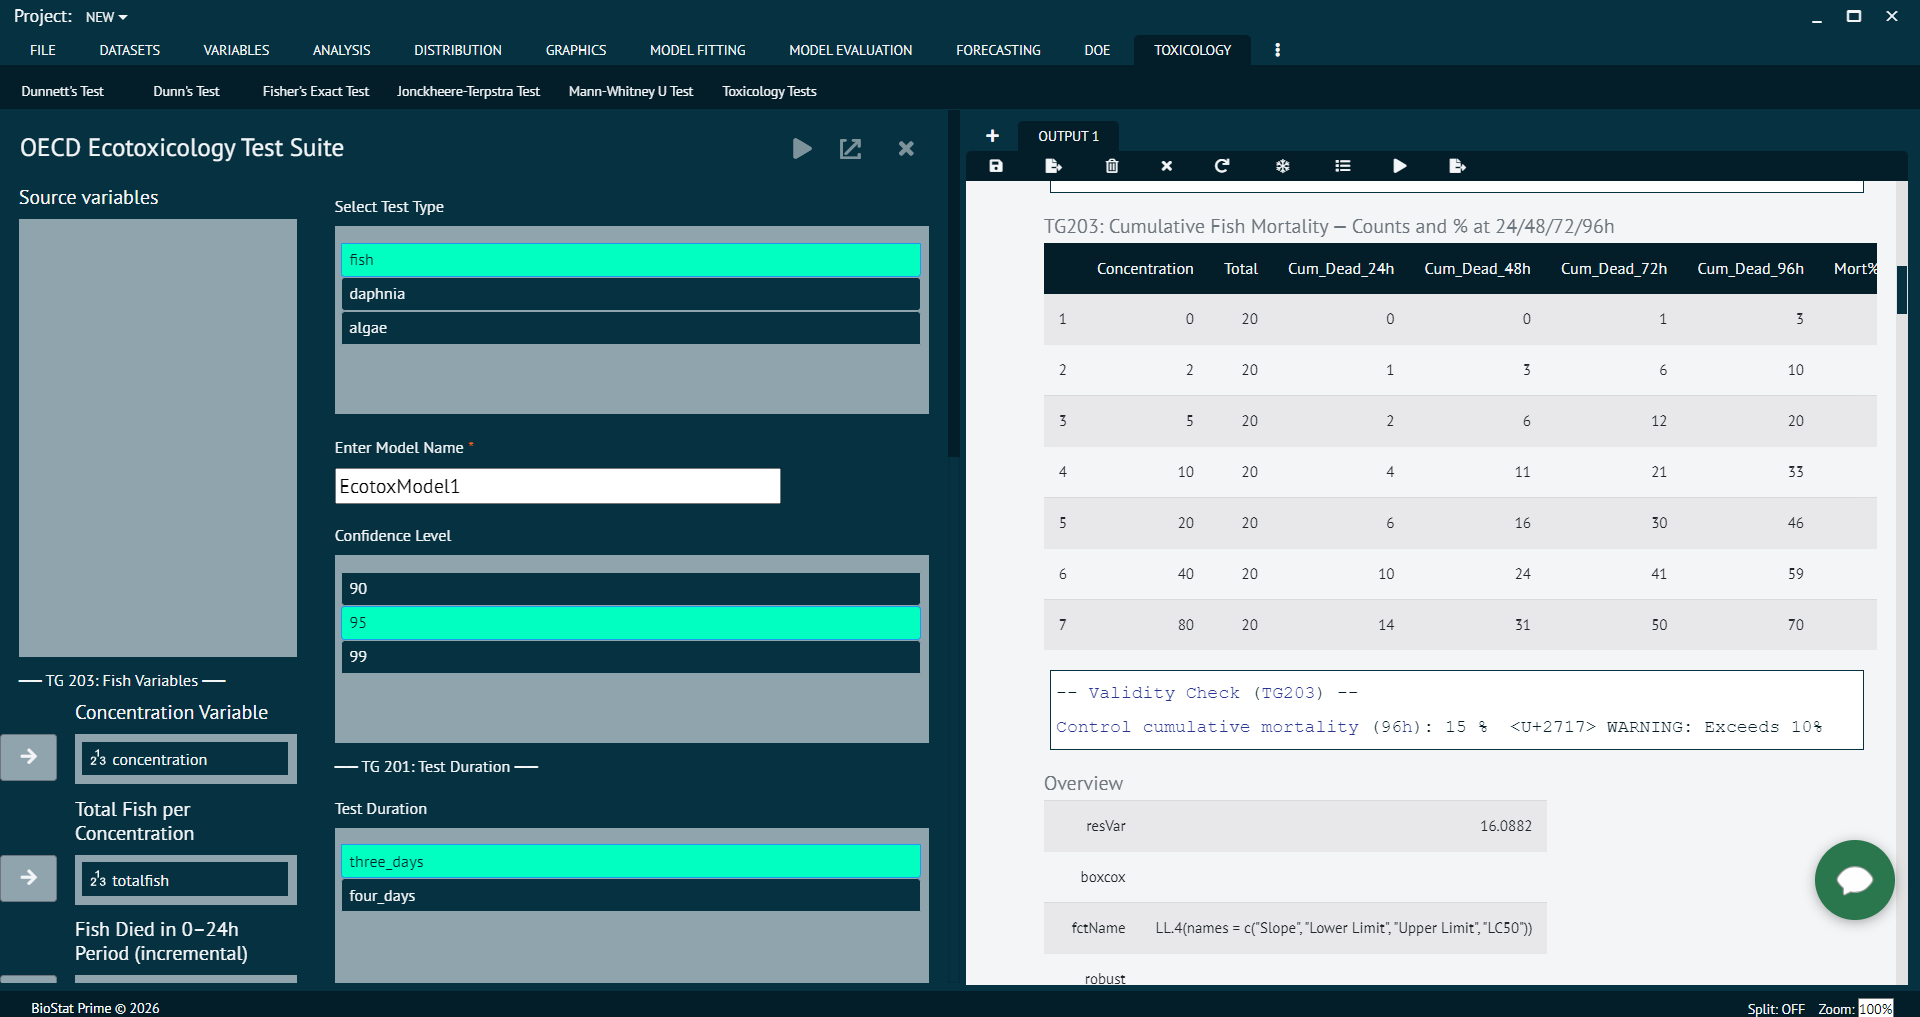
Determining the toxicity of a chemical substance is an essential part of toxicological and ecotoxicological research. One of the most widely used parameters for evaluating acute toxicity is LC50 (Lethal Concentration 50%).
LC50 represents the concentration of a substance that causes the death of 50% of the test organisms within a specified exposure period. It is commonly used in aquatic toxicity studies, environmental risk assessments, chemical safety evaluations, and ecotoxicological testing.
However, calculating LC50 requires properly structured experimental data, mortality observations at different time intervals, and appropriate statistical analysis.
ToxCore simplifies this process by providing an integrated toxicology analysis workflow. Researchers can import their experimental data, configure toxicity test parameters, estimate LC50 values at different time points, and generate dose-response plots within the software.
In this guide, we explain how to calculate LC50 in ToxCore, from preparing your dataset to interpreting the final statistical results.
ToxCore is a statistical software solution designed for toxicologists to analyze experimental toxicology data and evaluate treatment-related effects.
When performing LC50 analysis, researchers need to consider several variables, including test concentrations, the total number of organisms, mortality observations, and exposure duration.
ToxCore provides a structured workflow for analyzing these variables.
Key capabilities include:
These capabilities help researchers organize and interpret toxicity data within a single analytical workflow.
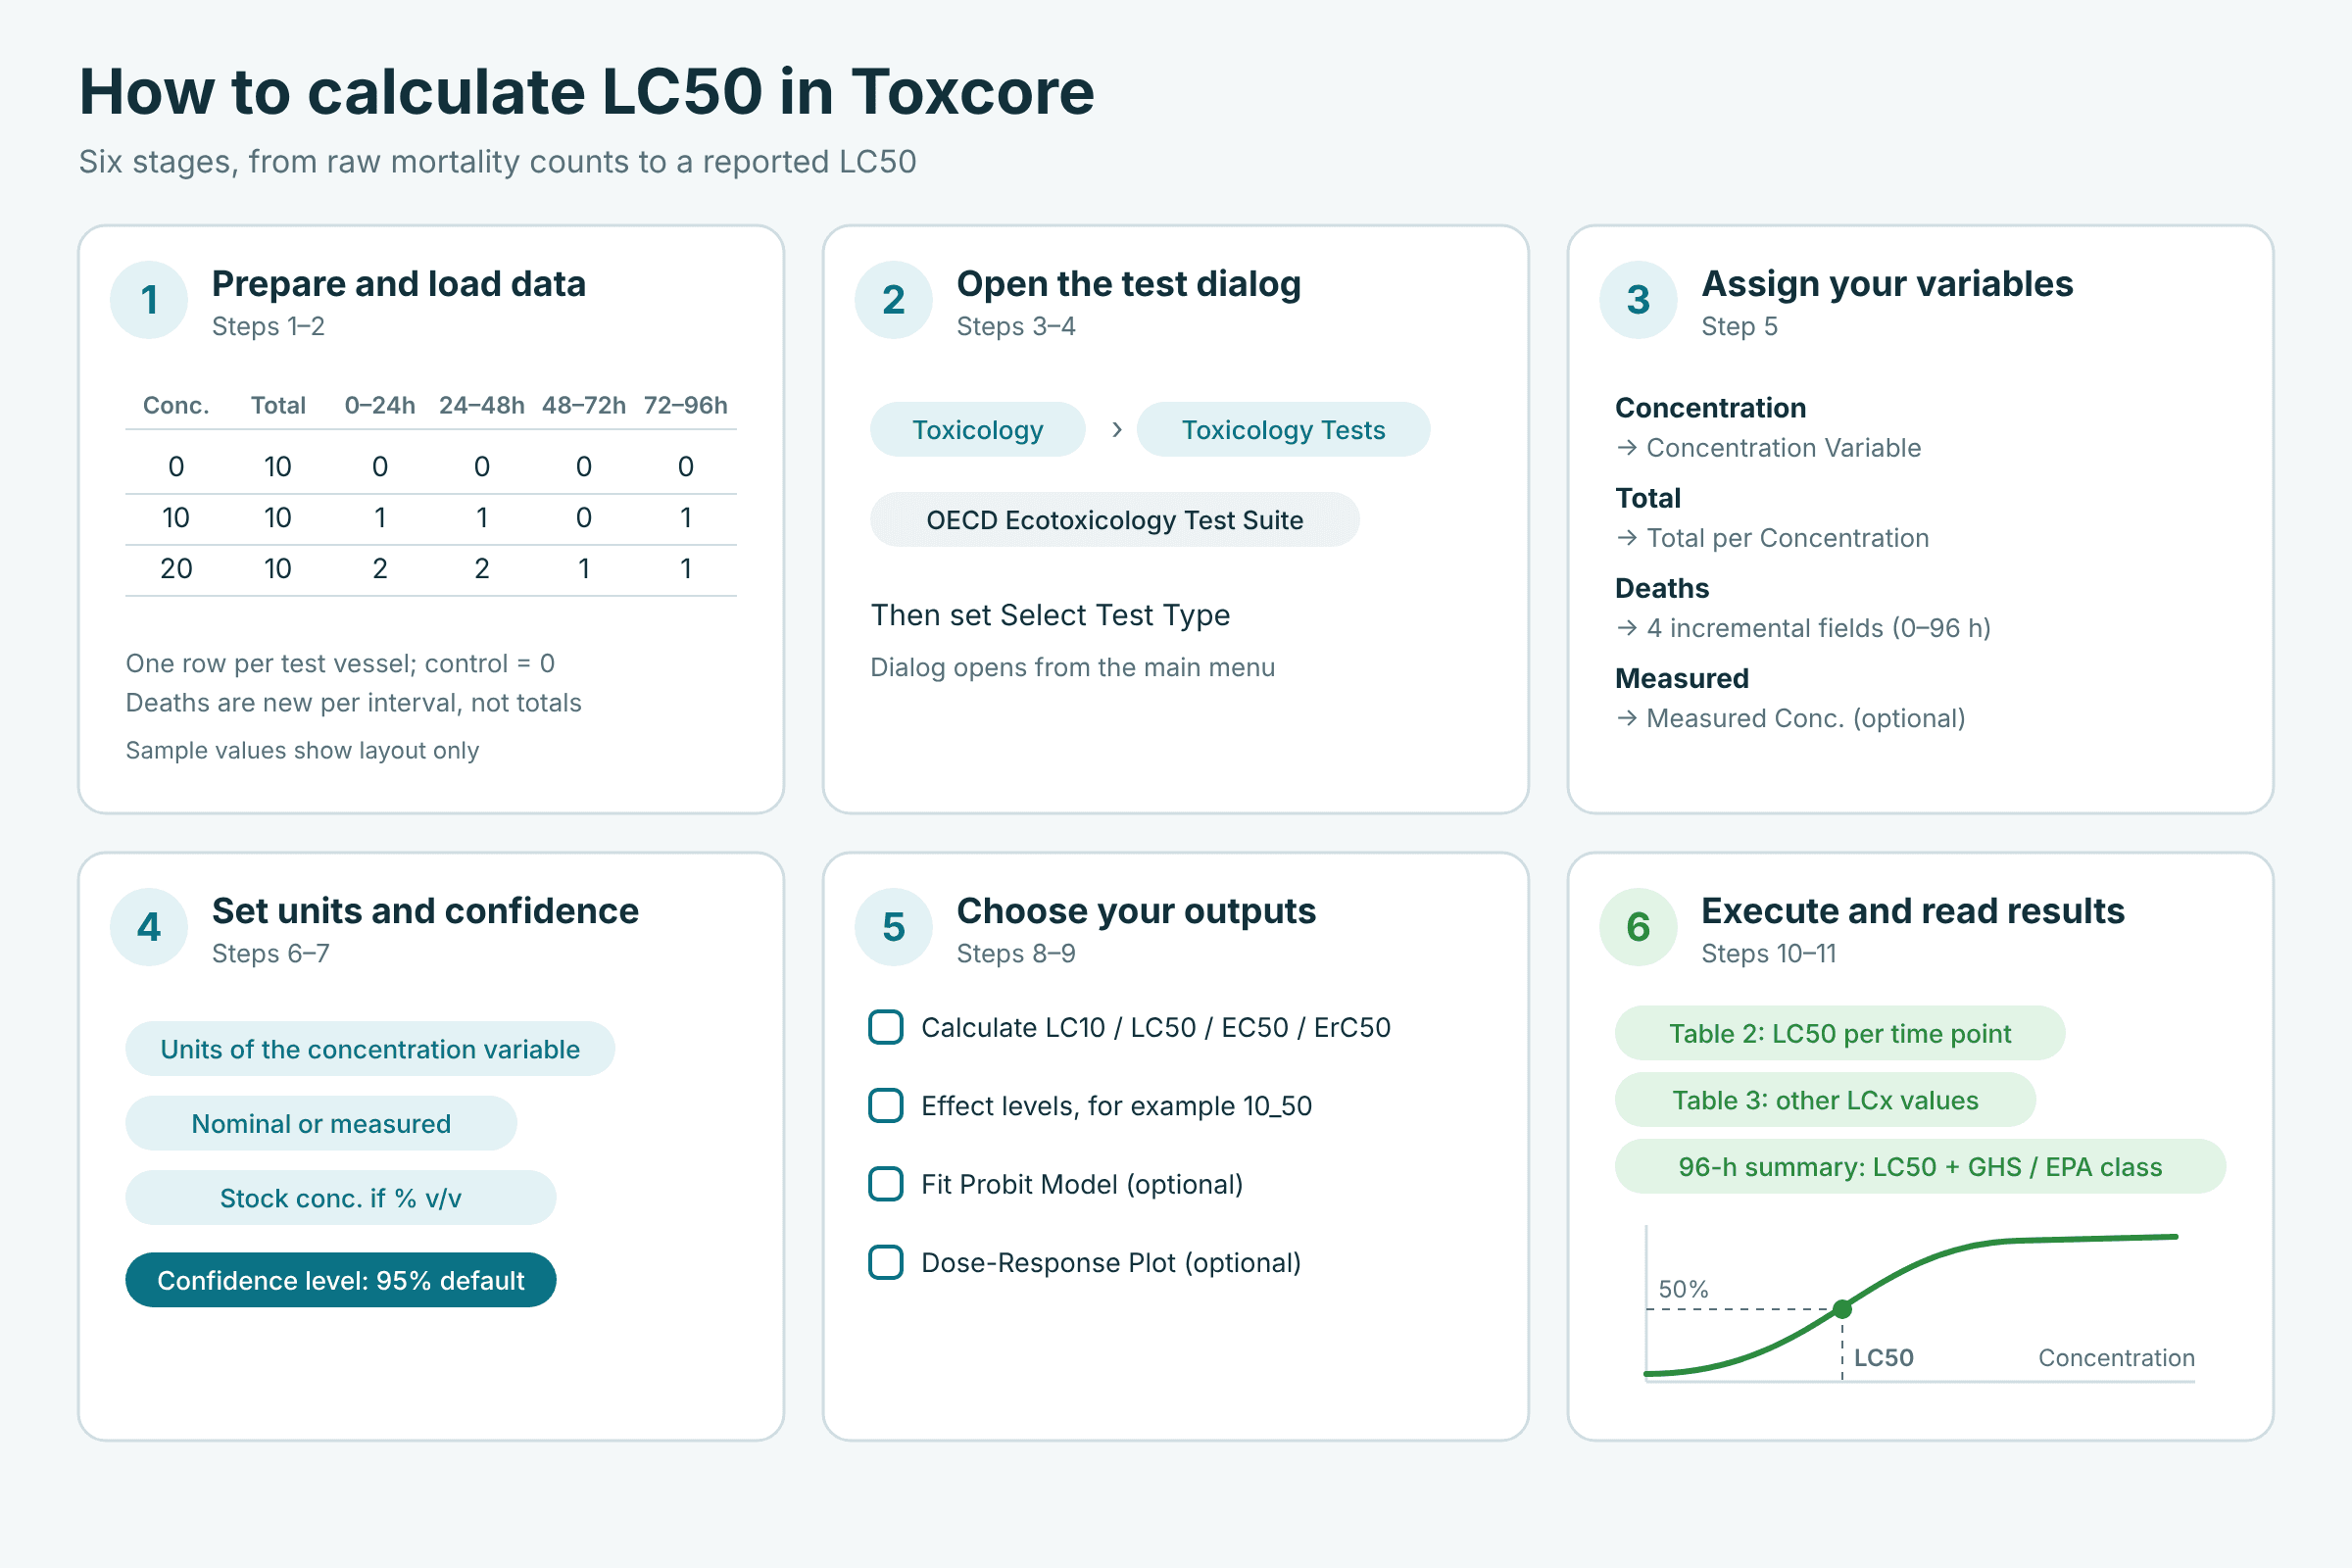
Follow the steps below to perform an LC50 toxicity analysis using ToxCore.
Before starting the analysis, organize your experimental dataset in a structured format.
Your dataset should contain one row per test vessel and the following columns:
| Variable | Description |
|---|---|
| Concentration | Test concentration, with the control represented as 0 |
| Number of organisms | Total number of organisms in each test vessel |
| 24-hour deaths | New deaths observed between 0 and 24 hours |
| 48-hour deaths | New deaths observed between 24 and 48 hours |
| 72-hour deaths | New deaths observed between 48 and 72 hours |
| 96-hour deaths | New deaths observed between 72 and 96 hours |
| Measured concentration | Optional column containing measured test concentrations |
Important: Enter new deaths observed during each interval rather than cumulative mortality.
For example, if 2 organisms die during the first 24 hours and another 3 die between 24 and 48 hours, enter 2 in the 24-hour death column and 3 in the 48-hour death column.
Do not enter 5 as the 48-hour observation. ToxCore uses incremental mortality observations for the respective time intervals.
Once your experimental data is ready:
Ensure that the dataset is complete and that the selected variables correspond to the correct experimental observations.
After loading your dataset:
This dialog provides the options required to configure and perform your toxicity analysis.
Within the OECD Ecotoxicology Test Suite dialog:
Make sure the selected test type corresponds to your experimental design and the toxicity endpoint being investigated.
Next, map the columns from your dataset to the corresponding fields in the analysis dialog.
Assign the variables as follows:
| ToxCore Field | Dataset Variable |
|---|---|
| Concentration Variable | Concentration column |
| Total per Concentration | Number of organisms |
| 0–24h | New deaths between 0 and 24 hours |
| 24–48h | New deaths between 24 and 48 hours |
| 48–72h | New deaths between 48 and 72 hours |
| 72–96h | New deaths between 72 and 96 hours |
| Measured Concentration | Measured concentration column (optional) |
Check each assignment carefully before proceeding.
Correct variable mapping is essential for obtaining meaningful toxicity estimates.
After assigning the variables, configure the concentration-related settings.
You need to specify:
1. Units of the Concentration Variable
Select the appropriate concentration unit used in your experiment, such as mg/L or µg/L.
2. Concentration Variable Is
Specify whether your concentration values represent:
3. Stock / Test-Solution Concentration
If your experimental concentrations are expressed as % v/v, enter the corresponding Stock / Test-Solution Concentration.
These settings help ensure that the software interprets your experimental concentration data correctly.
Choose the confidence level for your statistical analysis.
ToxCore provides 95% confidence as the default setting.
A 95% confidence level is commonly used in toxicological studies to assess the uncertainty associated with estimated toxicity parameters.
You can retain the default setting or select another confidence level if required by your experimental protocol.
To estimate the required toxicity endpoints:
For example, selecting 10_50 allows you to estimate:
Depending on the selected test type and endpoint, additional effect levels can also be estimated.
ToxCore also provides additional analysis and visualization options.
You can enable the following options according to your requirements:
Fit Probit Model
Select this option if you want ToxCore to fit a Probit model to your toxicity data.
Probit analysis is commonly used to estimate lethal concentration values by examining the relationship between chemical concentration and the proportion of organisms affected.
Generate Dose-Response Plot
Enable this option to generate a graphical representation of the relationship between concentration and mortality response.
The dose-response plot helps researchers visualize how mortality changes with increasing exposure concentrations.
Once all the variables and analysis settings have been configured:
ToxCore will process the experimental dataset and generate the corresponding toxicity analysis results.
After execution, review the generated output sections to identify the estimated LC50 values.
ToxCore provides the results in the following sections:
Table 2: LC50 Values at Different Time Points
Table 2 presents the estimated LC50 values for the different exposure periods.
You can review the LC50 estimates at:
These results help researchers understand how toxicity changes over the exposure period.
Table 3: Other LCx Values
Table 3 presents the other estimated LCx values based on the selected effect levels.
For example, if you selected 10 and 50, you can review the corresponding LC10 and LC50 estimates.
96-h Result
The 96-h Result section provides the results associated with the 96-hour exposure period.
This is particularly relevant for aquatic acute toxicity studies where 96-hour LC50 is an important toxicity endpoint.
Review the estimated values and their associated confidence intervals when interpreting the results.
Consider an aquatic toxicity experiment in which researchers expose test organisms to different concentrations of a chemical substance.
After 96 hours, the mortality observations are analyzed using ToxCore.
Suppose the software estimates a 96-hour LC50 of 12 mg/L.
This indicates that the estimated concentration associated with 50% mortality in the tested population is 12 mg/L under the experimental conditions.
Illustrative LC50 interpretation
12 mg/L
Estimated 96-hour LC50
A lower LC50 generally indicates greater acute toxicity under comparable experimental conditions, while a higher LC50 indicates lower acute toxicity.
However, LC50 values should only be compared when the test organisms, exposure duration, experimental conditions, and test methods are sufficiently comparable.
For reliable toxicity analysis, researchers should consider the following points:
If the data do not adequately cover the response range, or if mortality patterns are unsuitable for the selected model, the resulting LC50 estimate may be uncertain or not estimable. Researchers should review the model output rather than interpreting every numerical estimate as equally reliable.
Calculating LC50 is an important part of acute toxicity and ecotoxicological research. However, accurate estimation requires properly organized experimental data, appropriate statistical methods, and careful interpretation of the results.
With ToxCore, researchers can streamline the LC50 calculation workflow by importing experimental data, assigning concentration and mortality variables, selecting effect levels, fitting Probit models, and generating dose-response plots.
By bringing these analytical capabilities together, ToxCore helps toxicologists perform structured toxicity assessments and interpret concentration-dependent mortality data more efficiently.
Frequently Asked Questions (FAQs)
LC50 stands for Lethal Concentration 50%. It represents the concentration of a substance estimated to cause 50% mortality in a test population over a specified exposure period.
To calculate LC50 in ToxCore, import your experimental dataset, open Toxicology Tests under the Toxicology tab, select the appropriate test type, assign concentration and mortality variables, configure the confidence level, select LC50 under the effect levels, and execute the analysis.
Yes. The described ToxCore workflow supports LC50 estimation at 24, 48, 72, and 96 hours when the corresponding mortality observations are supplied.
Yes. ToxCore provides a Fit Probit Model option that can be enabled during the toxicity analysis workflow.
LC10 represents the concentration associated with an estimated 10% mortality, whereas LC50 represents the concentration associated with an estimated 50% mortality.
The 96-hour LC50 is commonly used in aquatic acute toxicity assessments to evaluate the lethal effects of chemical substances over a 96-hour exposure period.
Yes. You can enable Generate Dose-Response Plot before executing the analysis to obtain a graphical representation of the concentration-response relationship.