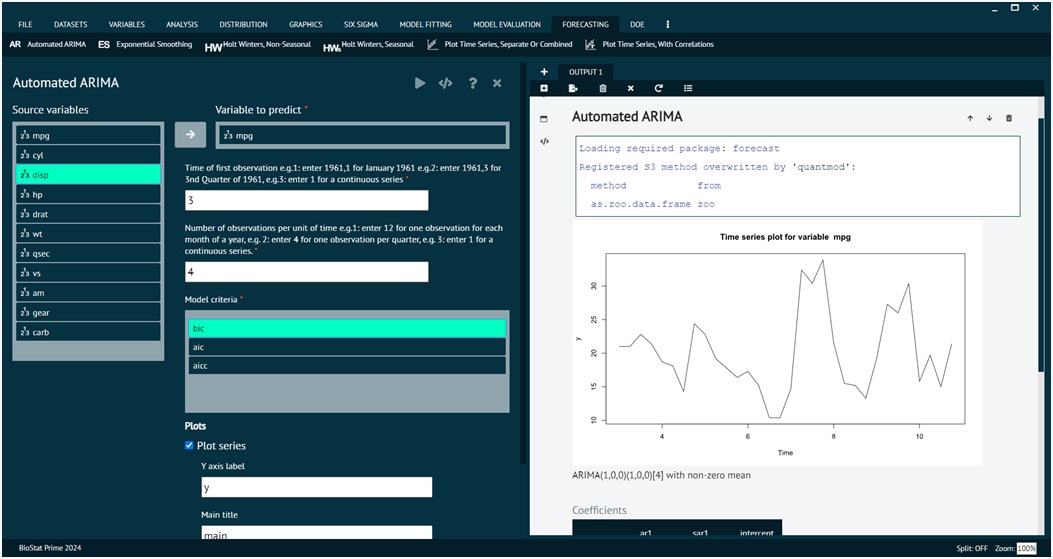
Forecasting in statistics refers to the process of making predictions about future values or trends based on historical data and patterns. It involves using statistical models, techniques, and methods to estimate future outcomes or trends in a time series or set of data points.
The primary goal of forecasting is to make informed decisions or plans by leveraging the information available from past observations. Forecasting often deals with time-ordered data, where observations are recorded sequentially over time. Examples include stock prices, sales data, weather measurements, and more. BioStat Prime has leveraged the use of its computing capacity by using R programming language because R provides numerous packages and functions specifically designed for time series forecasting.
Time Series Forecasting
Time series forecasting is the process of analyzing time series data using statistics and modeling to make predictions and inform strategic decision-making. Time series analysis shows how data changes over time, and good forecasting can identify the direction in which the data is changing.
ARIMA (Auto-Regressive Integrated Moving Average)

The ARIMA model stands for Auto-Regressive Integrated Moving Average), is the most widely used tool in time series forecasting which essentially creates a linear equation which describes and forecasts your time series data., ARIMA comprises three essential components making it capable of capturing and predicting patterns in time series data.
- AR stands for auto-regression. This component helps examine the relationship between an observation and past data points by accessing how past values influence the current observation and creates an equation based on the result.
- I correspond to integration or differencing which accounts for over all trends in the data by ensuring the statistical properties of the series are stationary that mean, variance remains constant over the time.
- MA stands for moving average which Traverses the relationship between an observation and a residual error or noise from past data points which helps to smooth out random fluctuations in the data.
ARIMA is represented by (p,d,q) parameters.
- p - AutoRegressive Order: The number of lag observations included in the model. The p value, or AR part, essentially describes how reliant your data points are on past data points. If p=1 then the model's output for a specific time relies directly on what the output was for the time before. If p=2, then the output would rely on the outputs from the last two time periods.
- d - Integrated Order: The d value refers to how many times you would need to take the derivative of your time series trend to get a flat line (or constant). we would likely use d=1 to account for its linear trend. If the trend were quadratic, we would probably have to use d=2.
- q - Moving Average Order: The size of the moving average terms. The difference is that q describes how related your current output is to its past error or noise calculations. So, if q=1, then your current output would rely on the past time period's noise calculation. For q=2, your output would rely on the noise from the last two time periods.
Together, the p, d, and q parameters define the behavior of the ARIMA model. Selecting appropriate values for these parameters is crucial for building an effective and accurate forecasting mode.
Exponential Smoothing
Exponential smoothing is a forecasting technique used in univariate time series data. This method yields forecasts that are weighted average of past observation, that is the older observation exponentially decreases with more recent observations receiving higher weights It is particularly useful for smoothing out short-term fluctuations and revealing underlying trends and patterns in the data. There are various Exponential methods which include simple, double, and triple (Holt-Winters) exponential smoothing.
1. Simple Exponential Smoothing (SES)
Simple Exponential Smoothing is the simplest form of Exponential technique which is suitable for time series data without a clear trend or seasonality. It uses a single smoothing parameter (alpha) to assign weights to past observations. This method estimates only the level component like average values, the alpha determines the degree of smoothness and can ranges from 0 to 1, lower values produce smoother lines they give more weight to past observation as a result they average out fluctuations with the time while higher values are more jagged lines as they weigh current data more highly, which reduces the degree of averaging by the older data.
2. Double Exponential Smoothing (Holt's Method)
.jpg)
Double Exponential Smoothing, also known as Holt's Method, which models dynamic gradients because it extends to capture trends in the data and the level component for univariant time series data where trends are basically slopes of data. In addition to the smoothing parameter (α), it introduces a trend smoothing parameter (β) where beta can be between 0 and 1.
3. Triple Exponential Smoothing (Holt-Winters Method)
.jpg)
Triple Exponential Smoothing, or the Holt-Winters Method, adds a seasonality component to capture recurring patterns in the data that it can model seasonality, trend, and level components for univariate time series data while Seasonal cycles are patterns in the data that occur over a number of observations. It introduces a seasonality smoothing parameter (γ) which lies between 0 and 1. In triple exponential smoothing, seasonality can be multiplicative which has a pattern in which magnitude increases with the increase in data or additive seasonality where the pattern has a constant scale even as the observation.